Charts
33 chart types on one configuration contract
A D3-backed Angular charting library where the chart type is a configuration choice rather than a different component with a different API. Every type reads the same theme tokens, so a consuming application restyles all thirty-three by swapping one bridge — and composition, annotation and tooltip content are cross-cutting layers rather than per-chart features.
170 published stories in Storybook
Composite charts
Two chart types in one coordinate space: bars carrying the measure, trend lines drawn over the same scales.
Chart types
Each one takes the same configuration object and reads the same theme tokens.
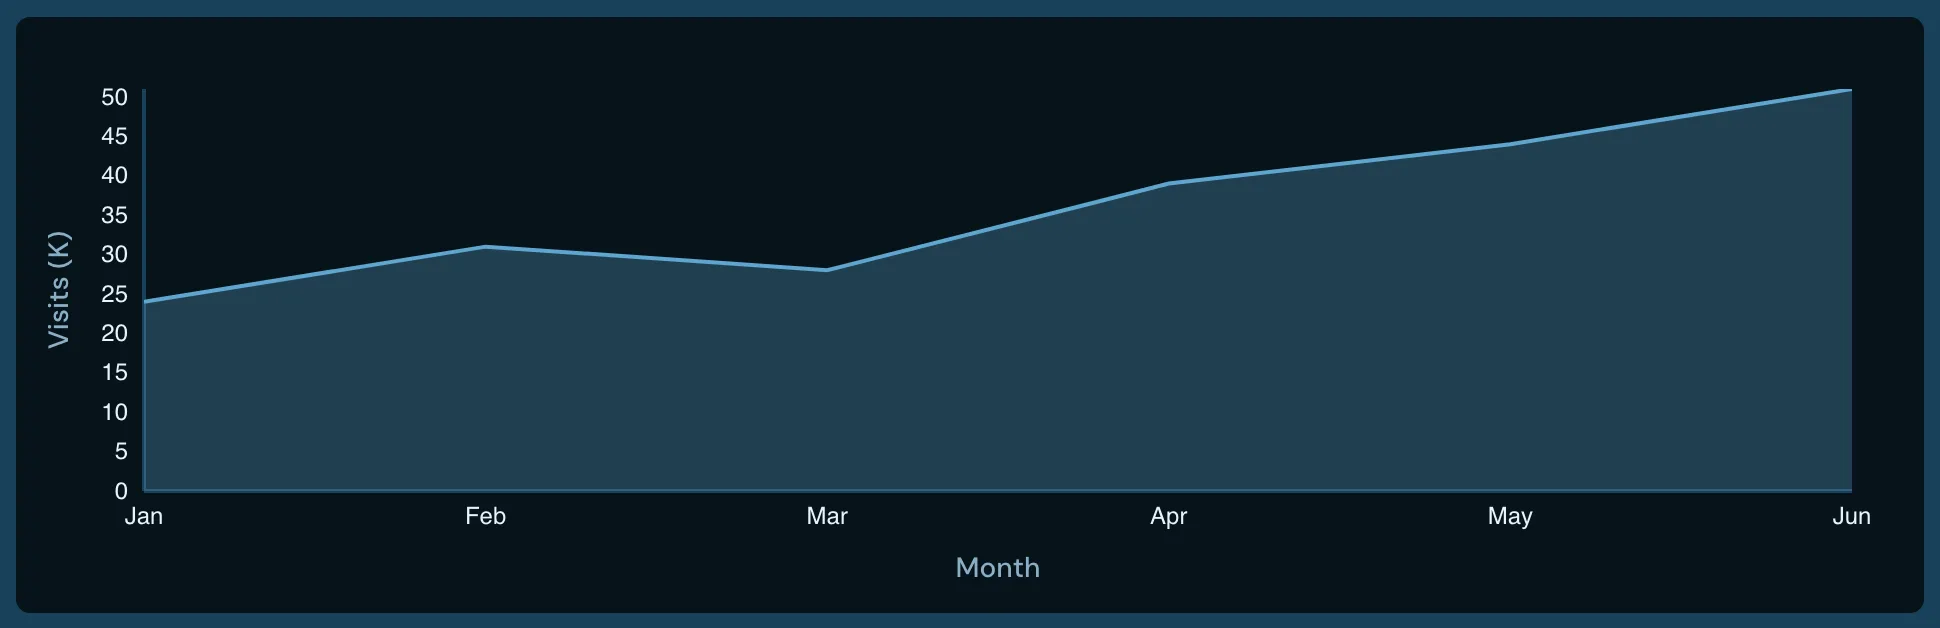 AreaA line with the region beneath it filled, for reading magnitude rather than only direction.
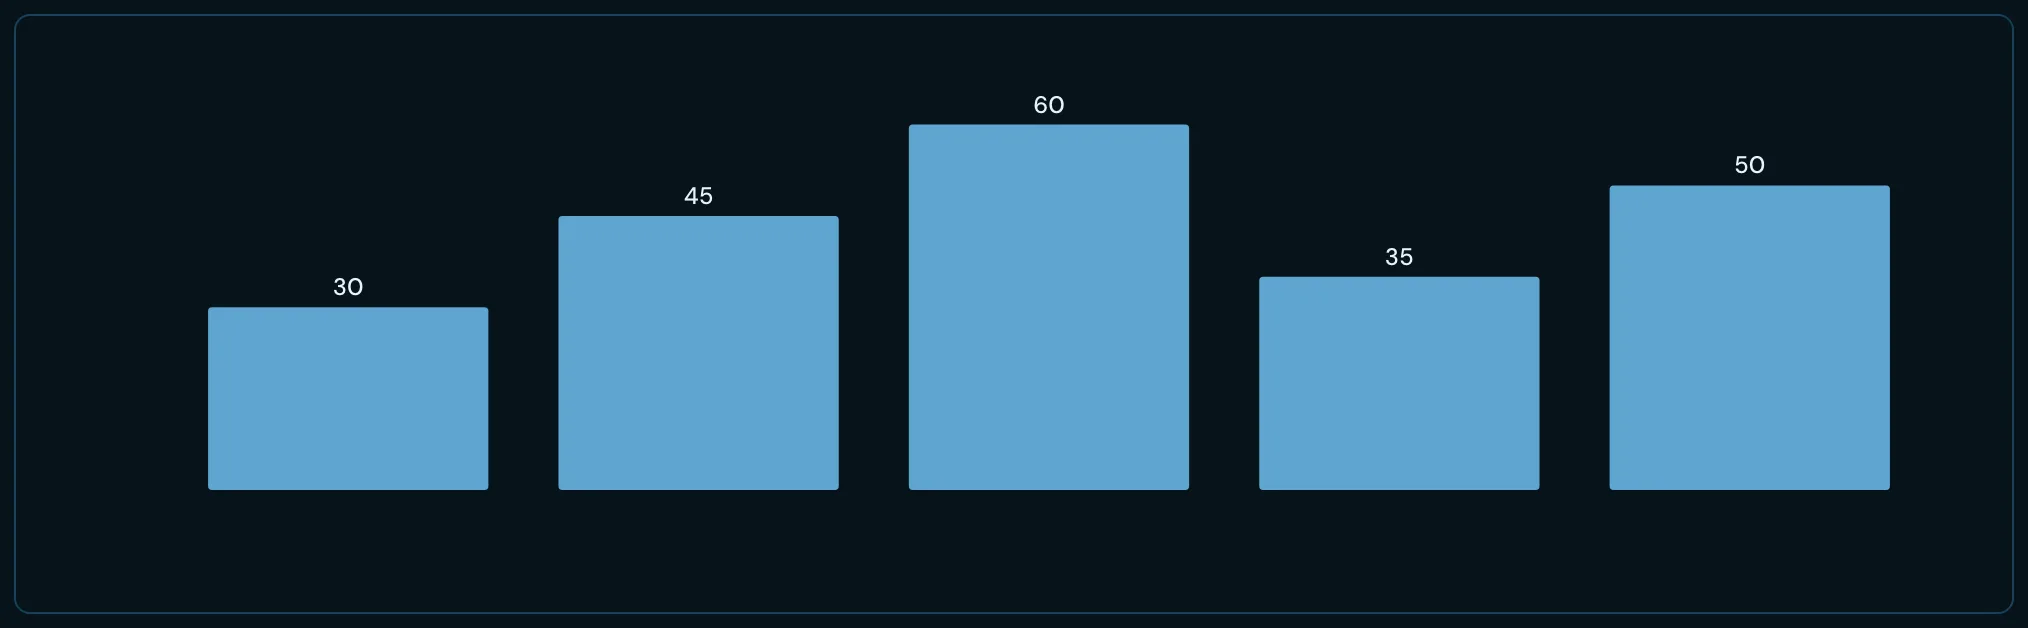 BarCategorical comparison on a single measure — the default for ranked or nominal data.
 BulletA measure against its target and qualitative ranges, in the height of one row.
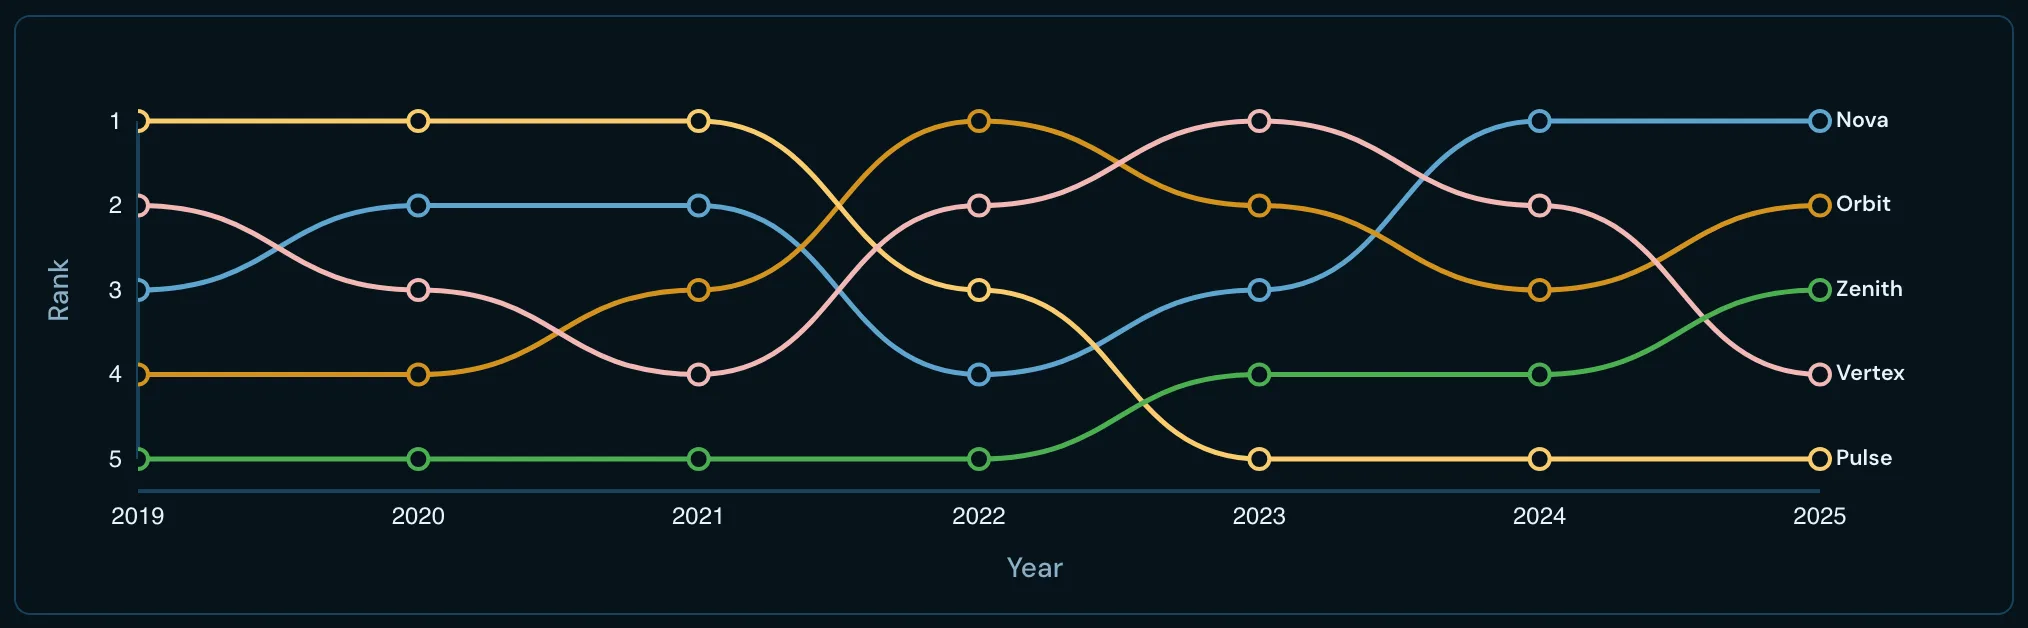 BumpRank over time: series trade vertical position as their ordering changes.
 ChordFlows between members of a single set, drawn as ribbons around a circle.
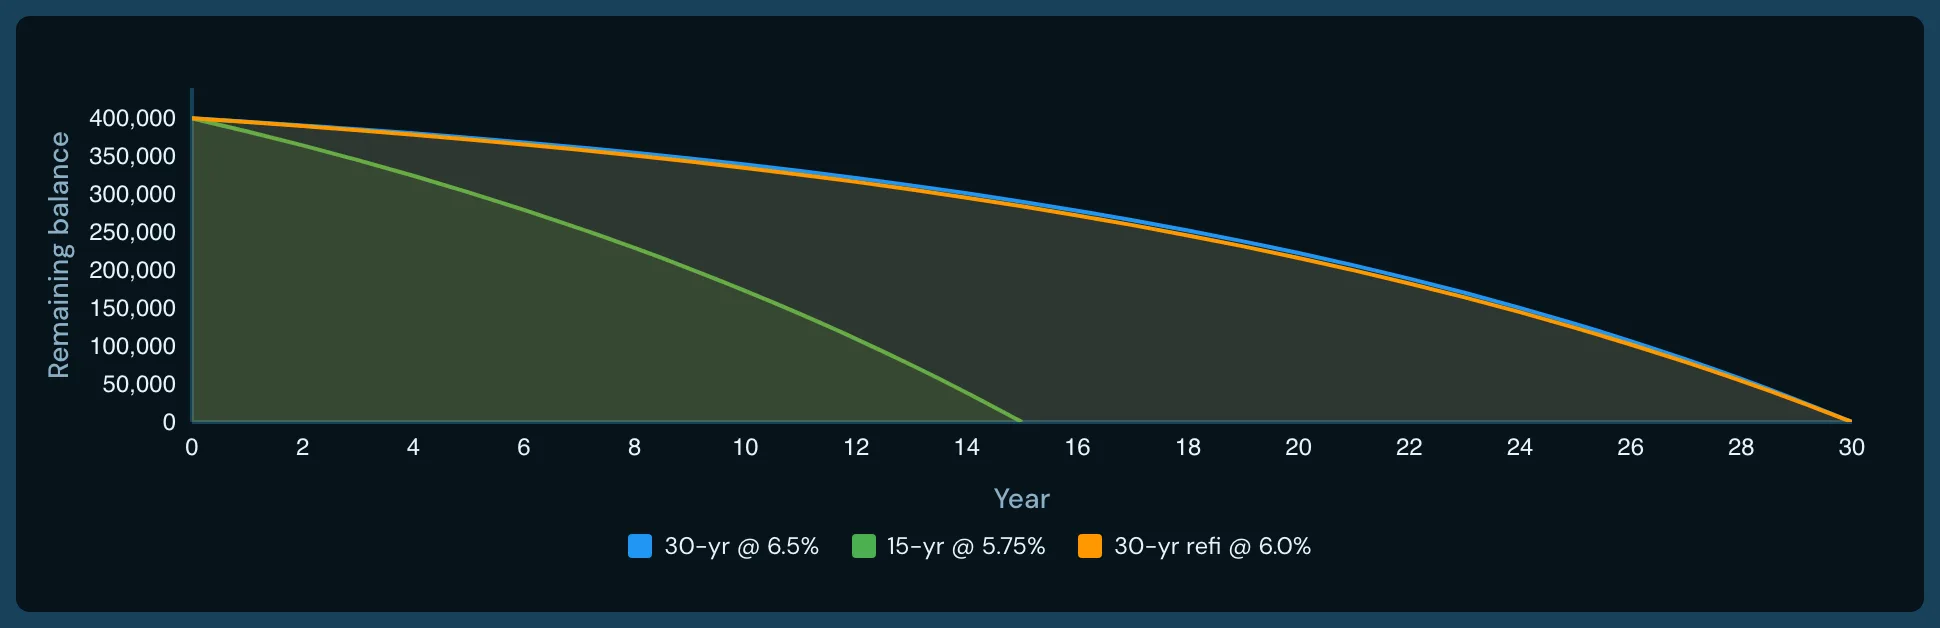 Comparison areaTwo filled series on shared scales, so the gap between them carries the comparison.
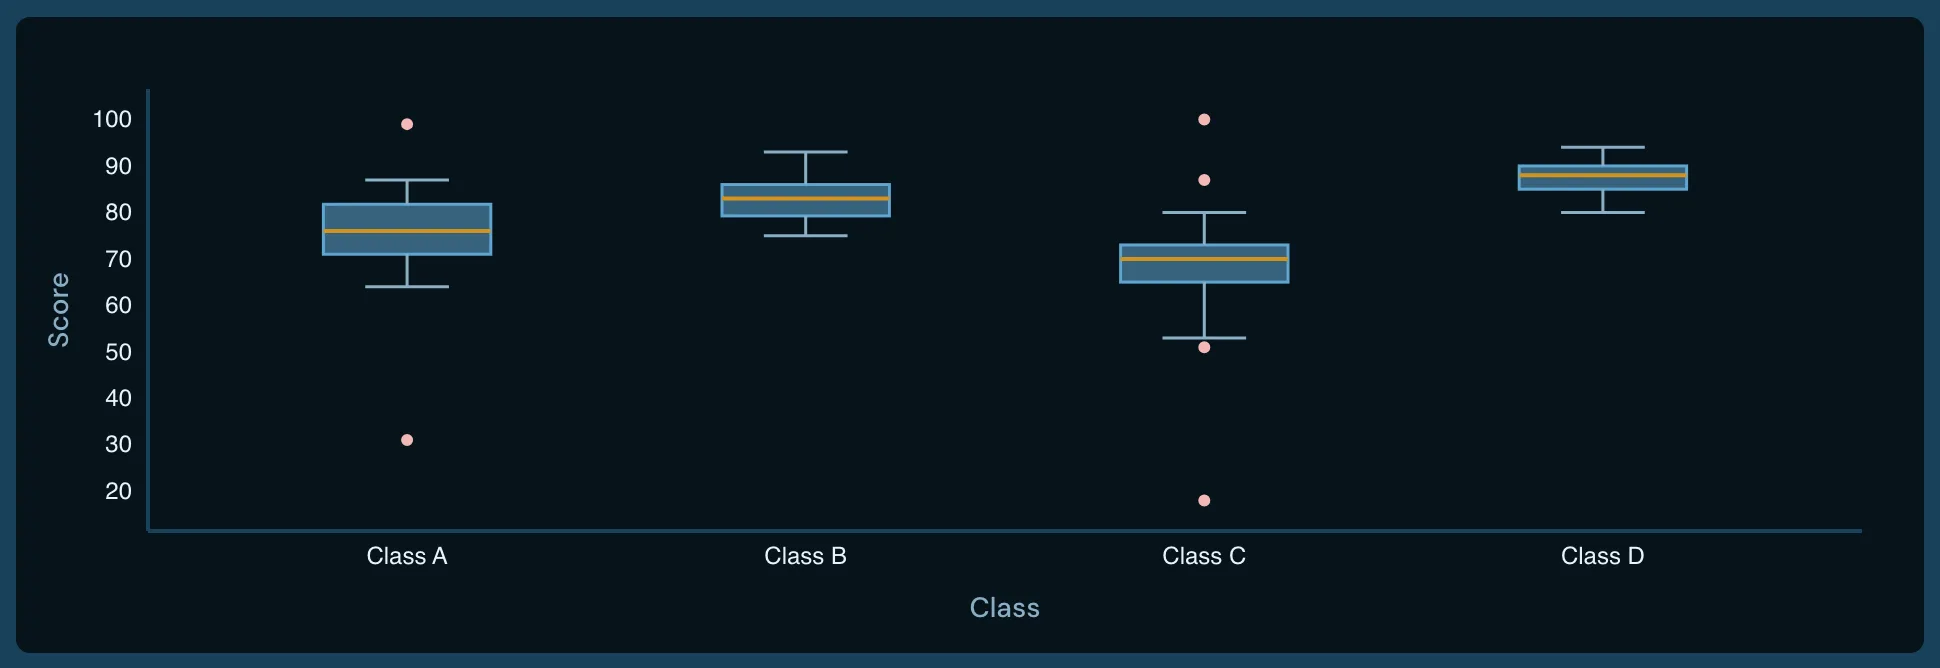 DistributionBox-and-whisker by default, with violin and point views of the same spread.
 Diverging barBars running both directions from a shared baseline, for signed change.
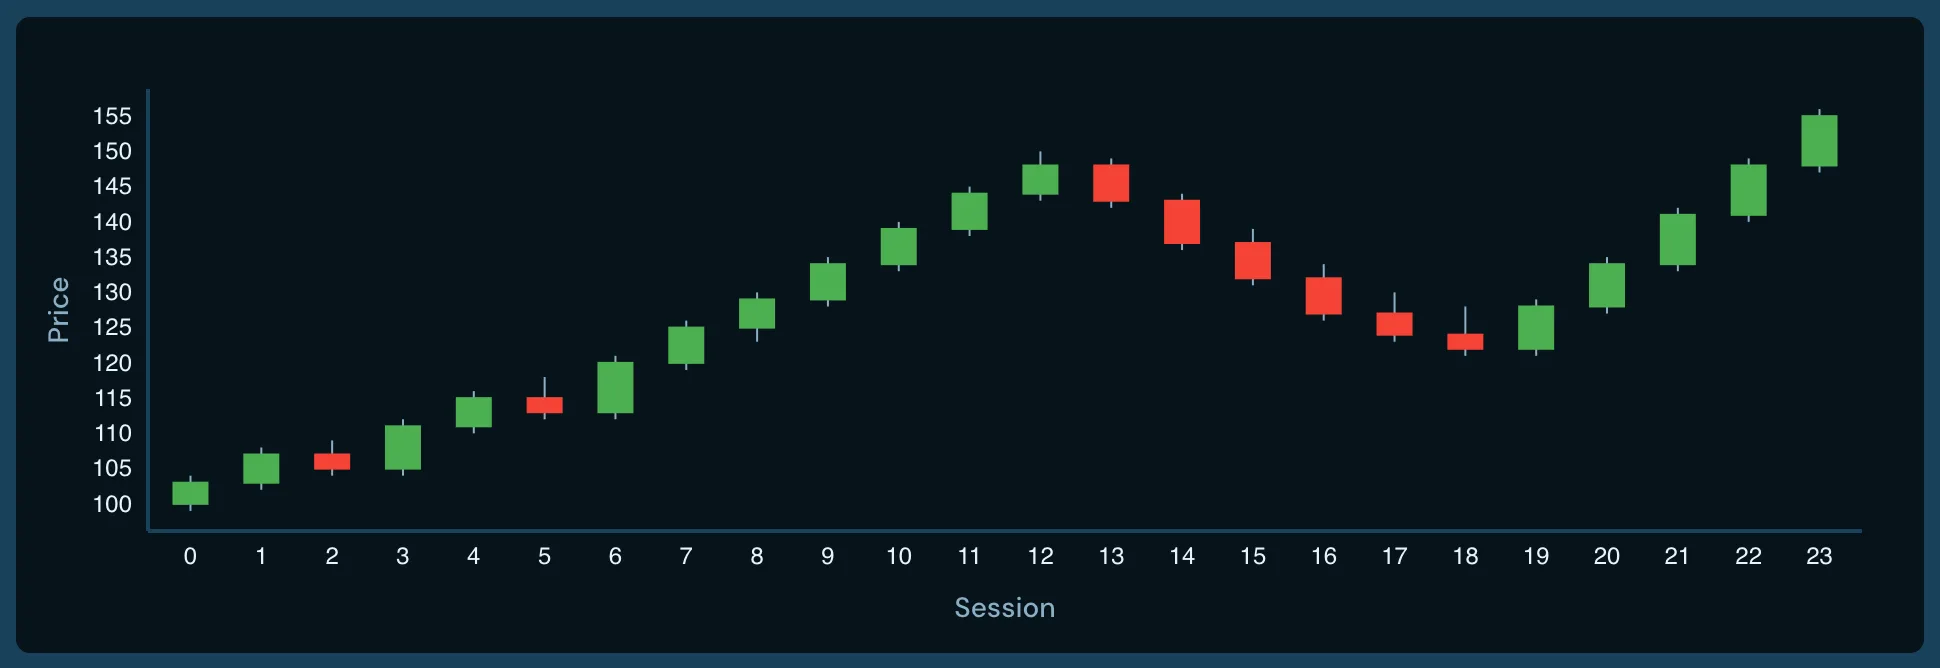 FinancialOpen, high, low and close candles over a time axis.
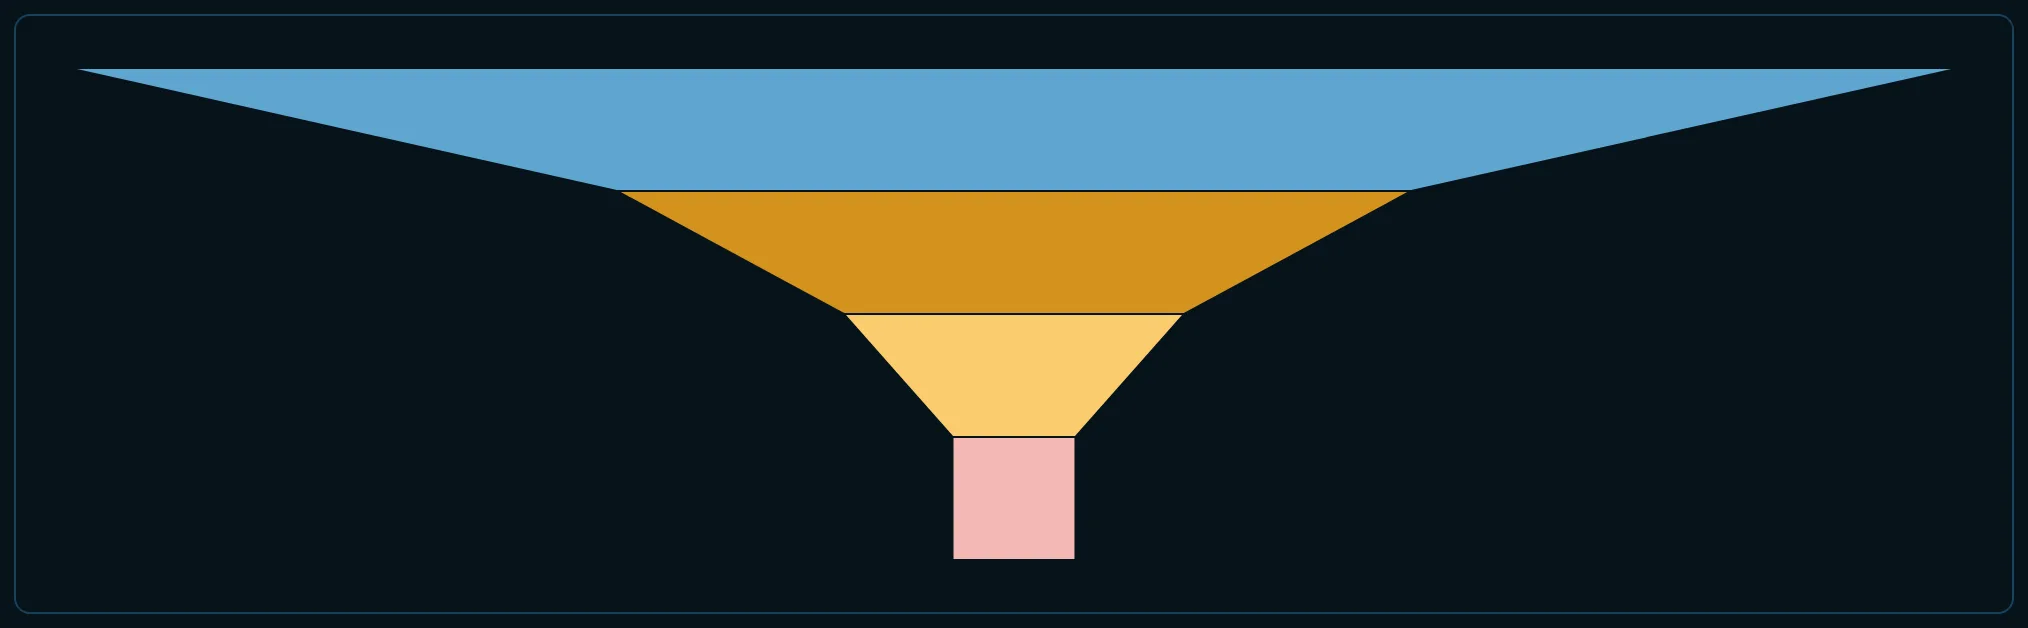 FunnelStage-by-stage falloff through a sequential process, as a funnel or a pyramid.
 GaugeA single value against its range on a radial dial.
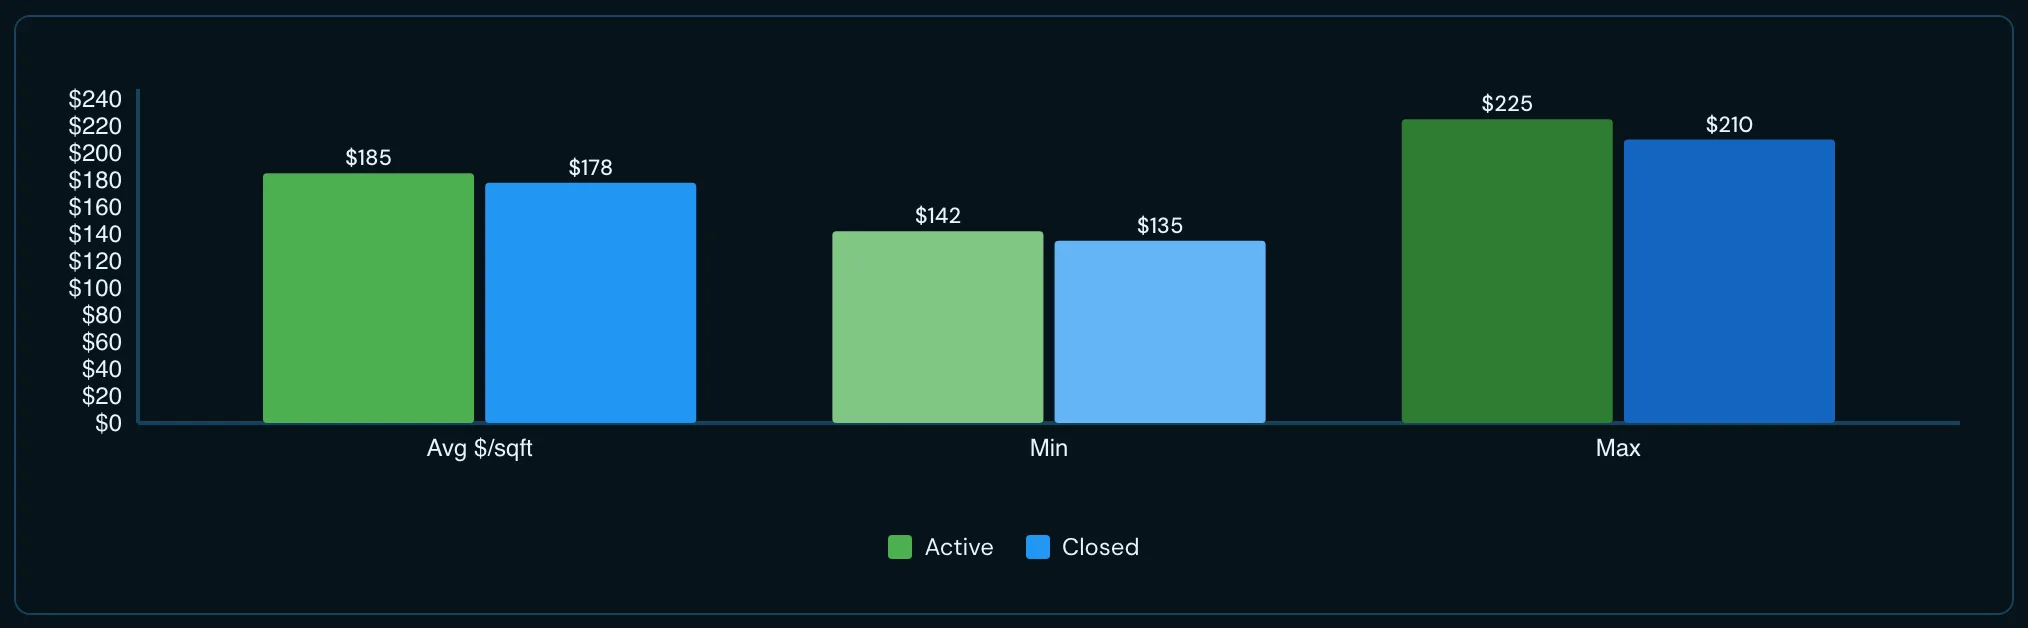 Grouped barSeveral series set side by side within each category.
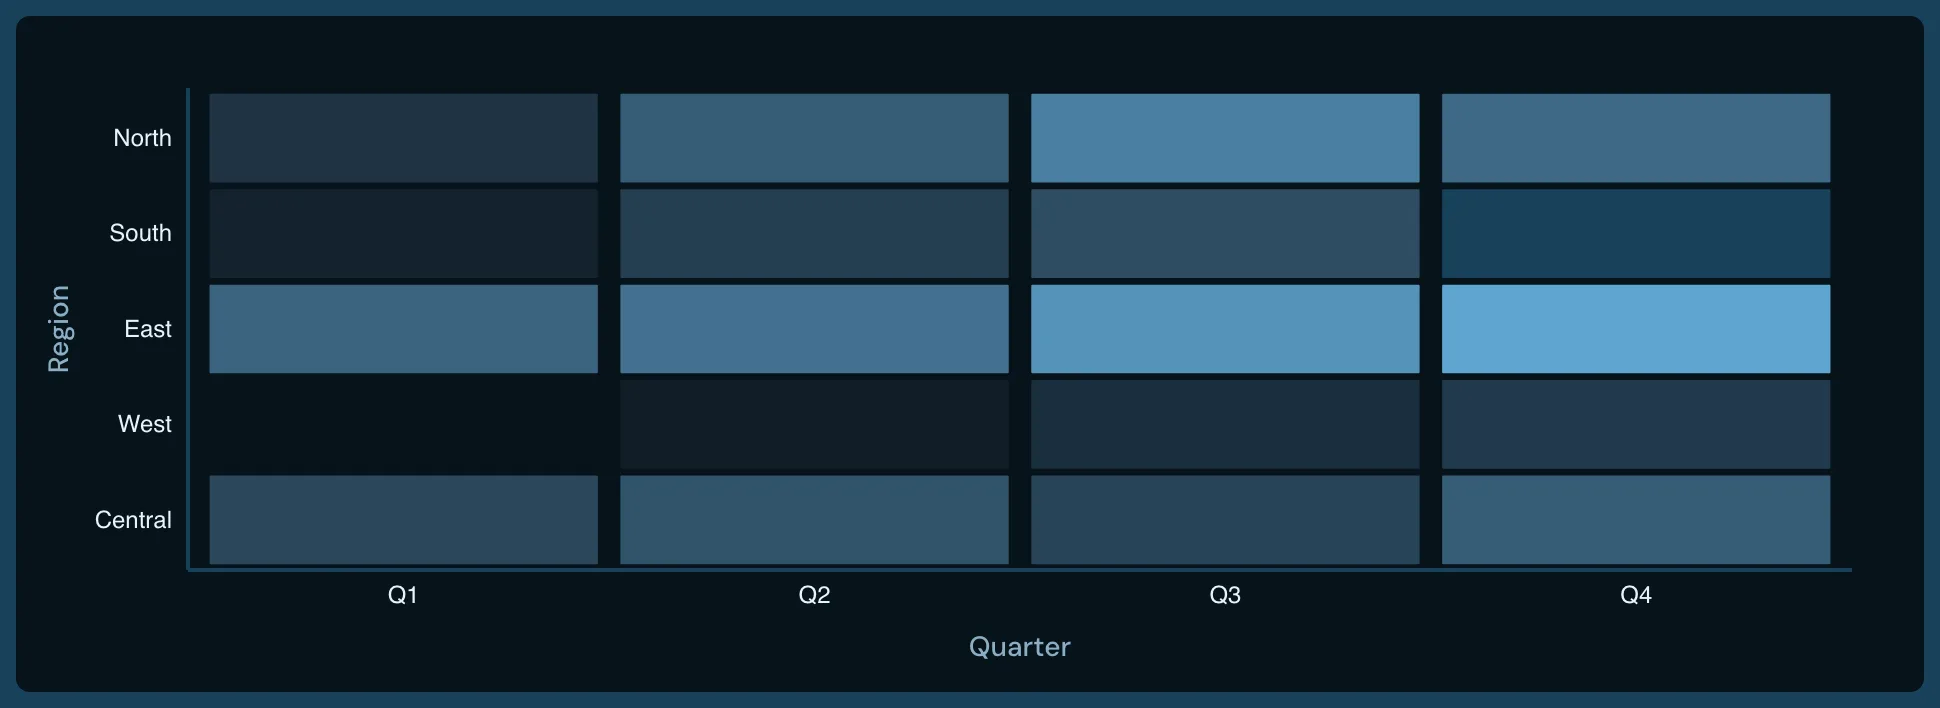 HeatmapA value grid across two categorical axes, encoded as colour or as bubble size.
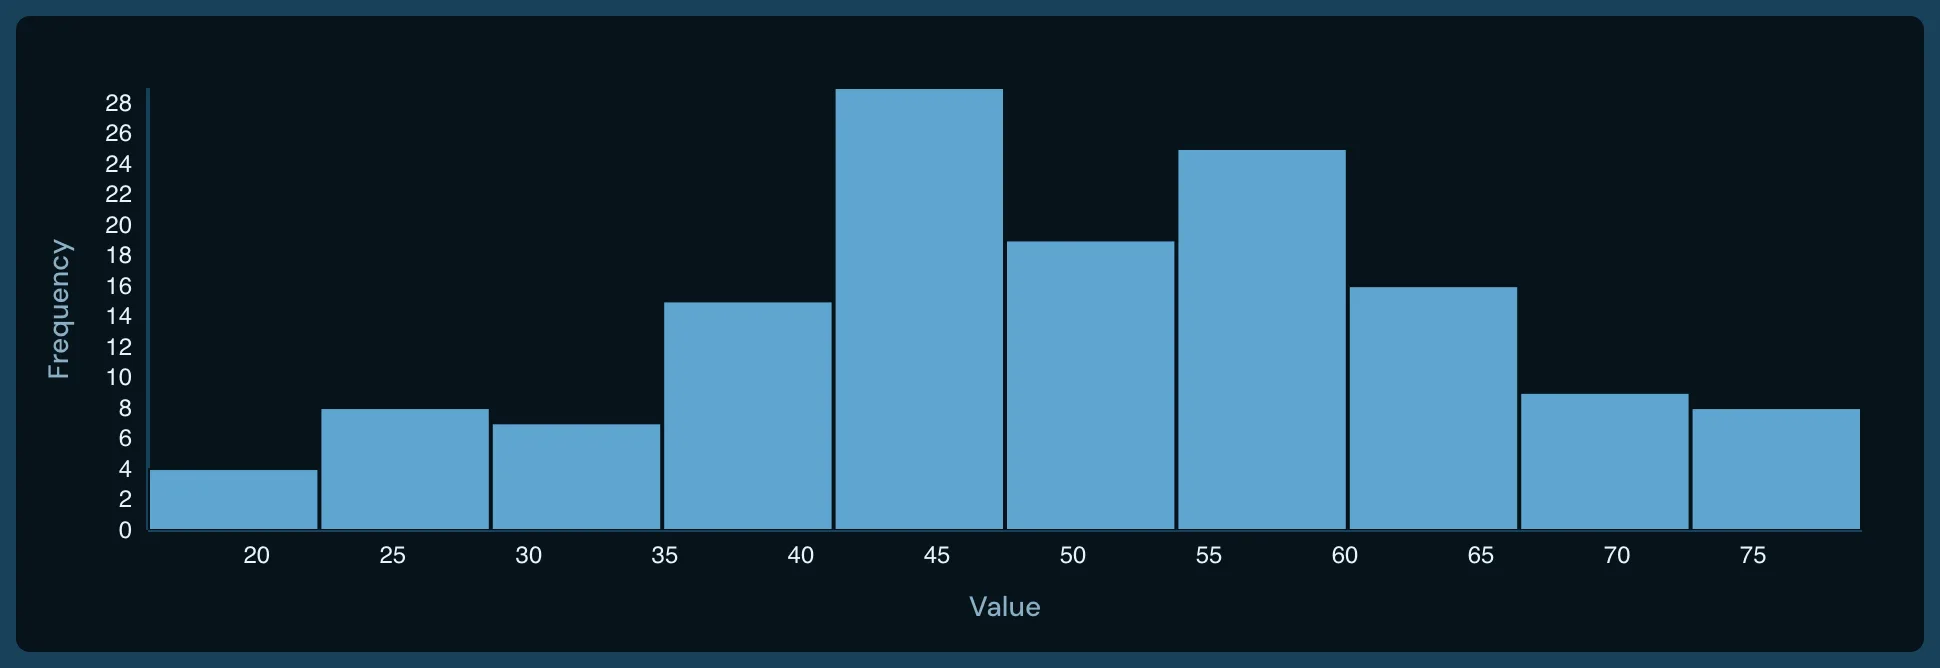 HistogramFrequency of a continuous variable across binned intervals.
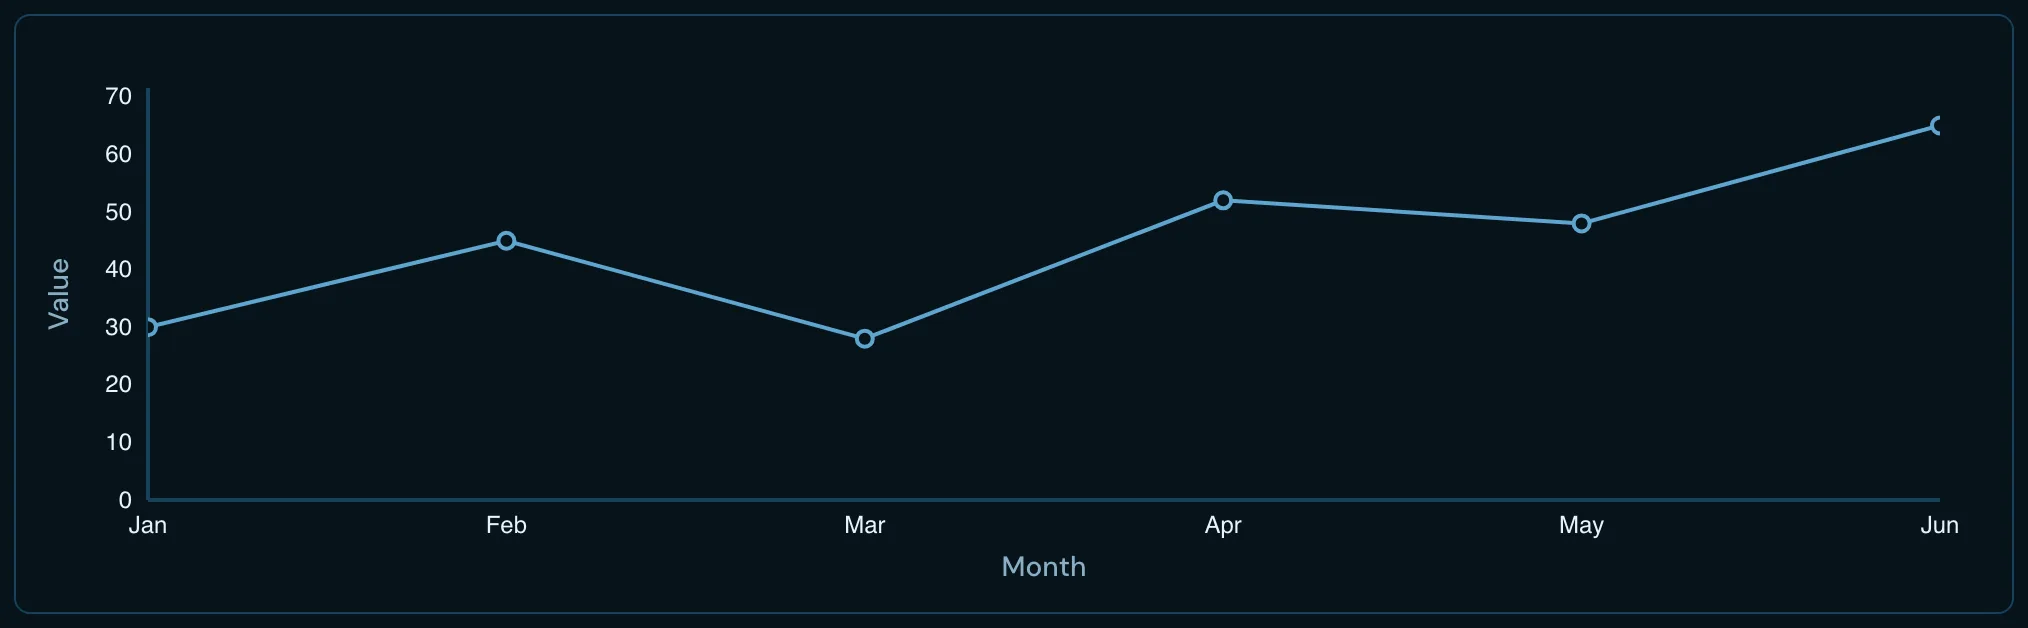 LineContinuous change over an ordered axis — the baseline time series.
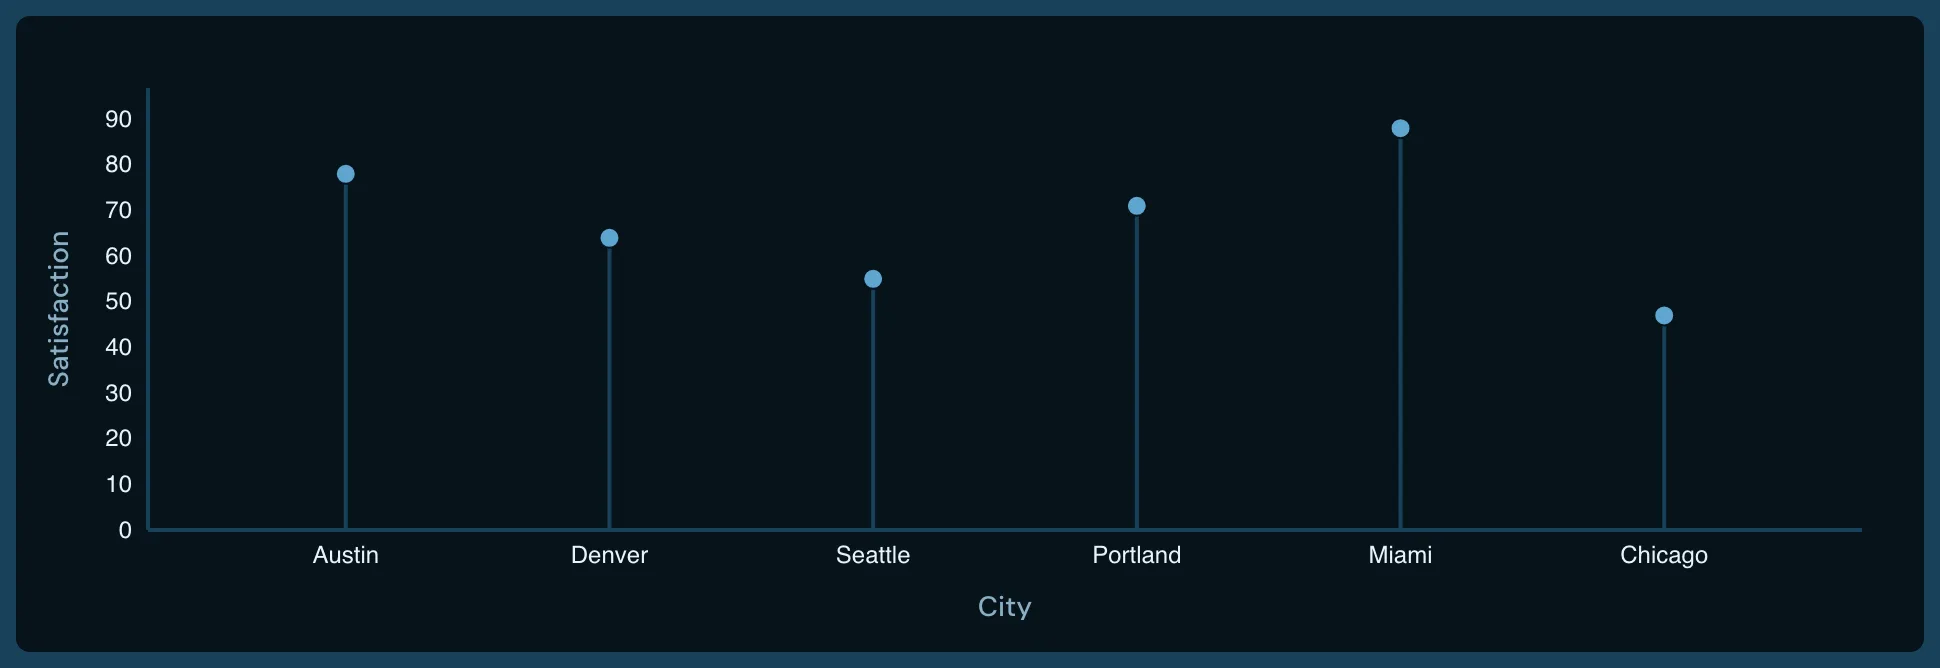 LollipopA bar reduced to a stem and a dot — and a dot plot once the stem is dropped.
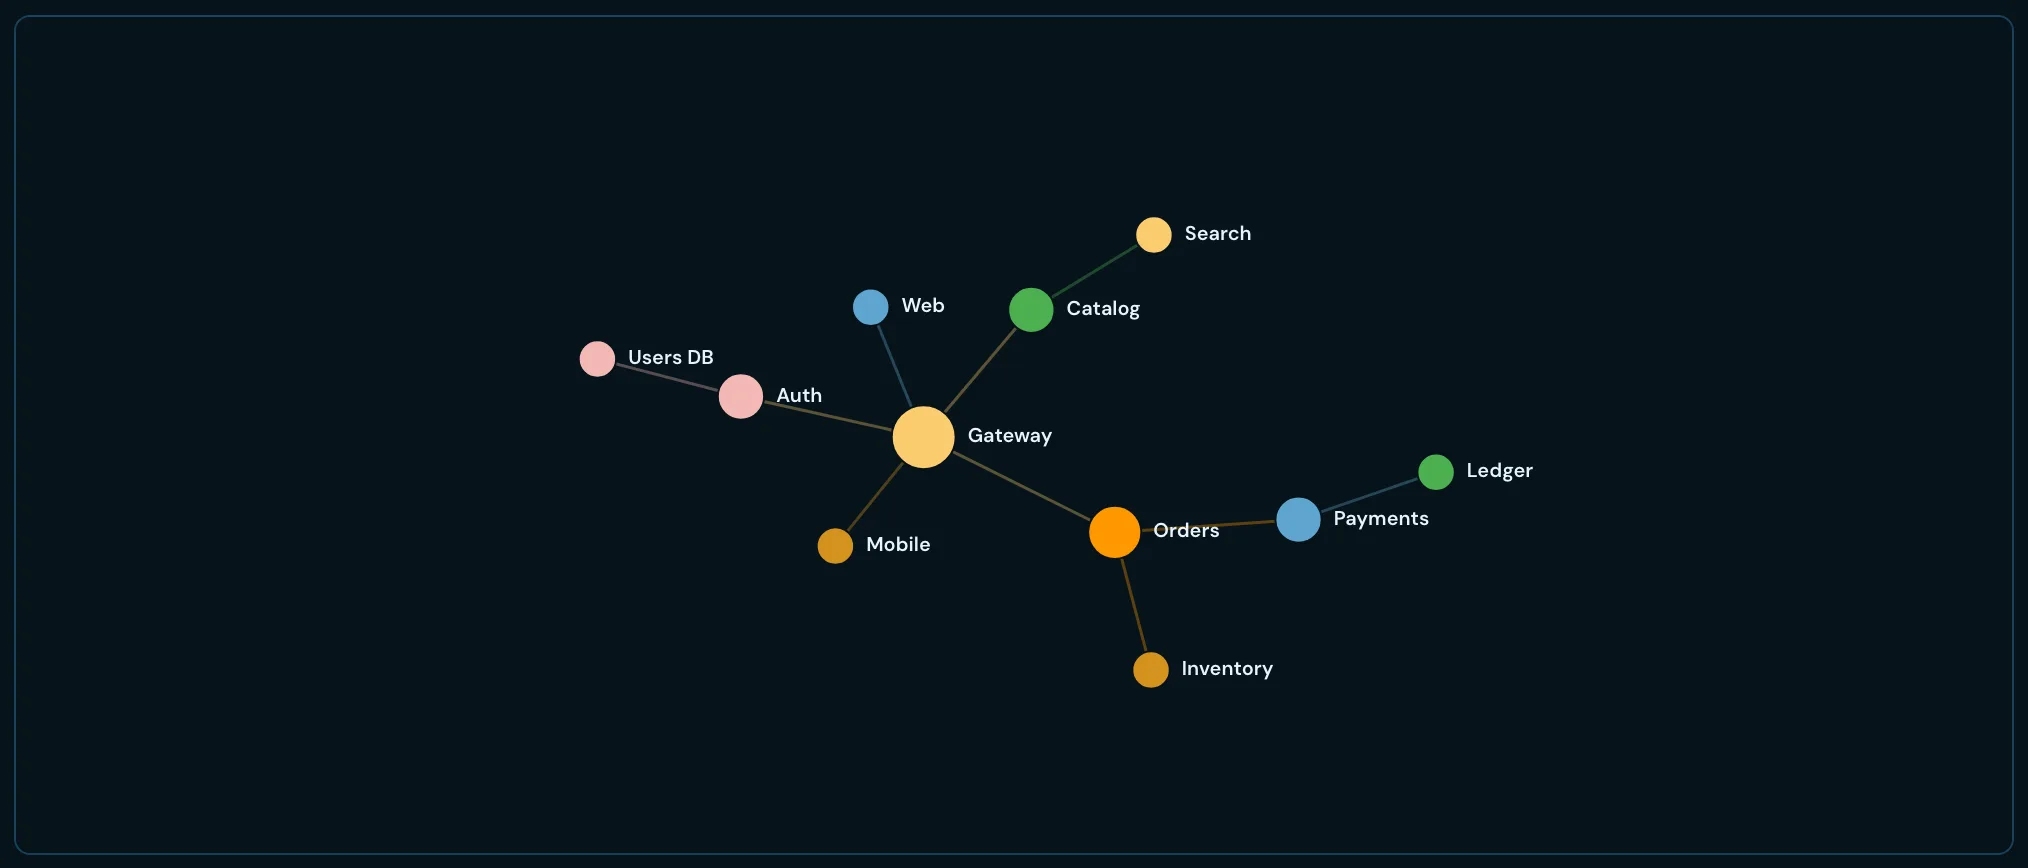 NetworkForce-directed nodes and edges, for relationship structure rather than magnitude.
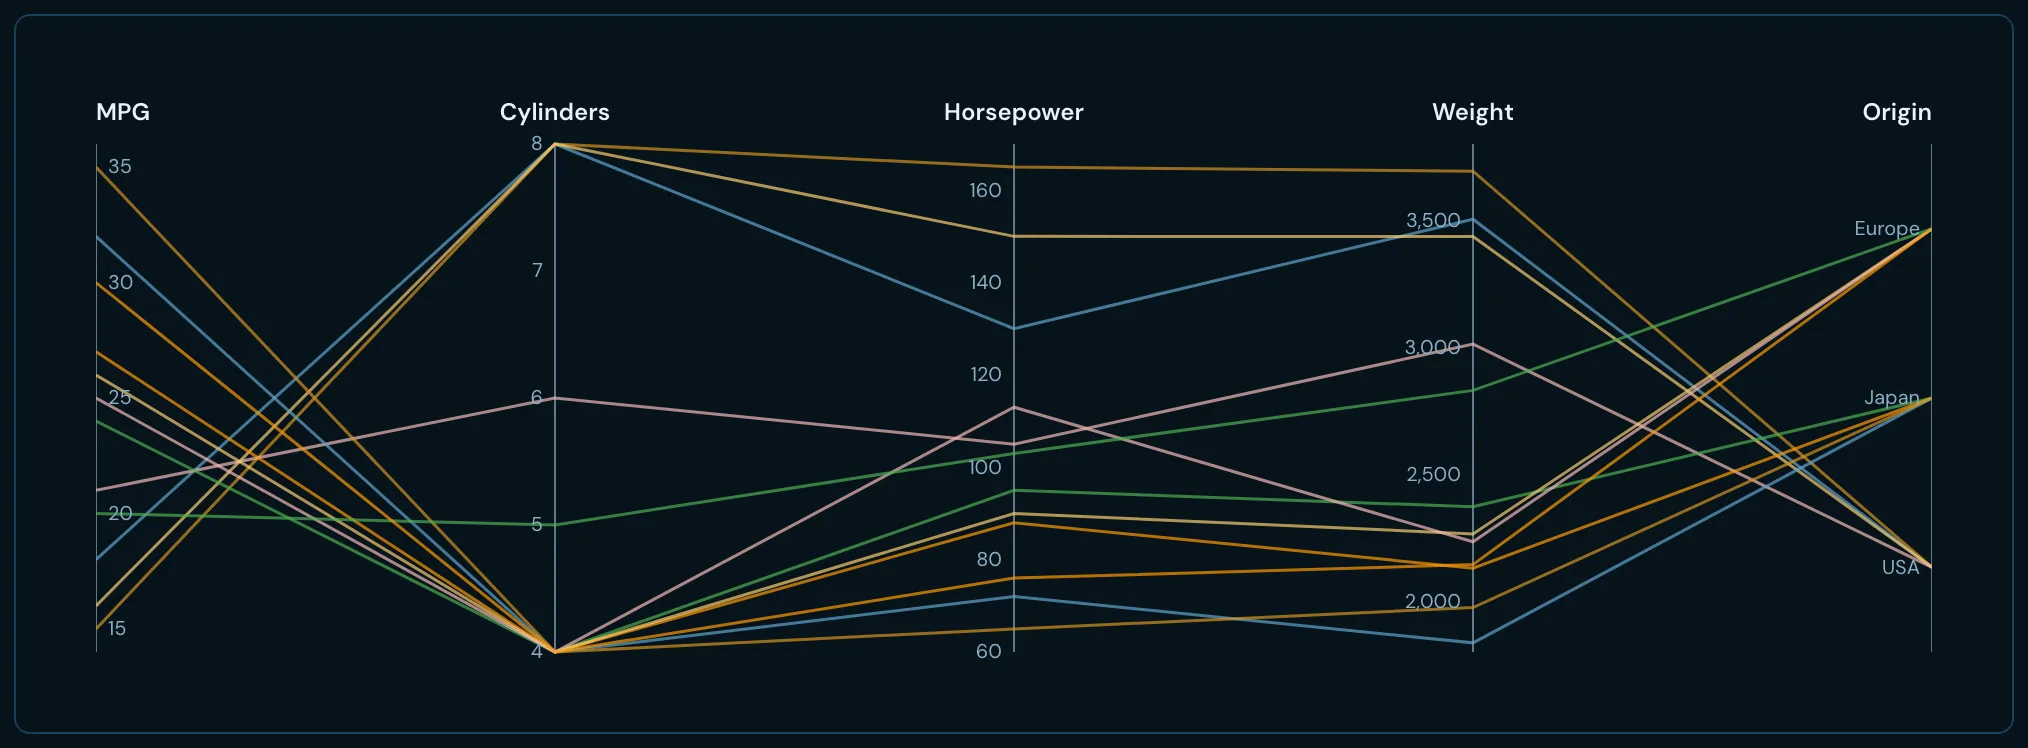 Parallel coordinatesMultivariate records as lines crossing several parallel axes.
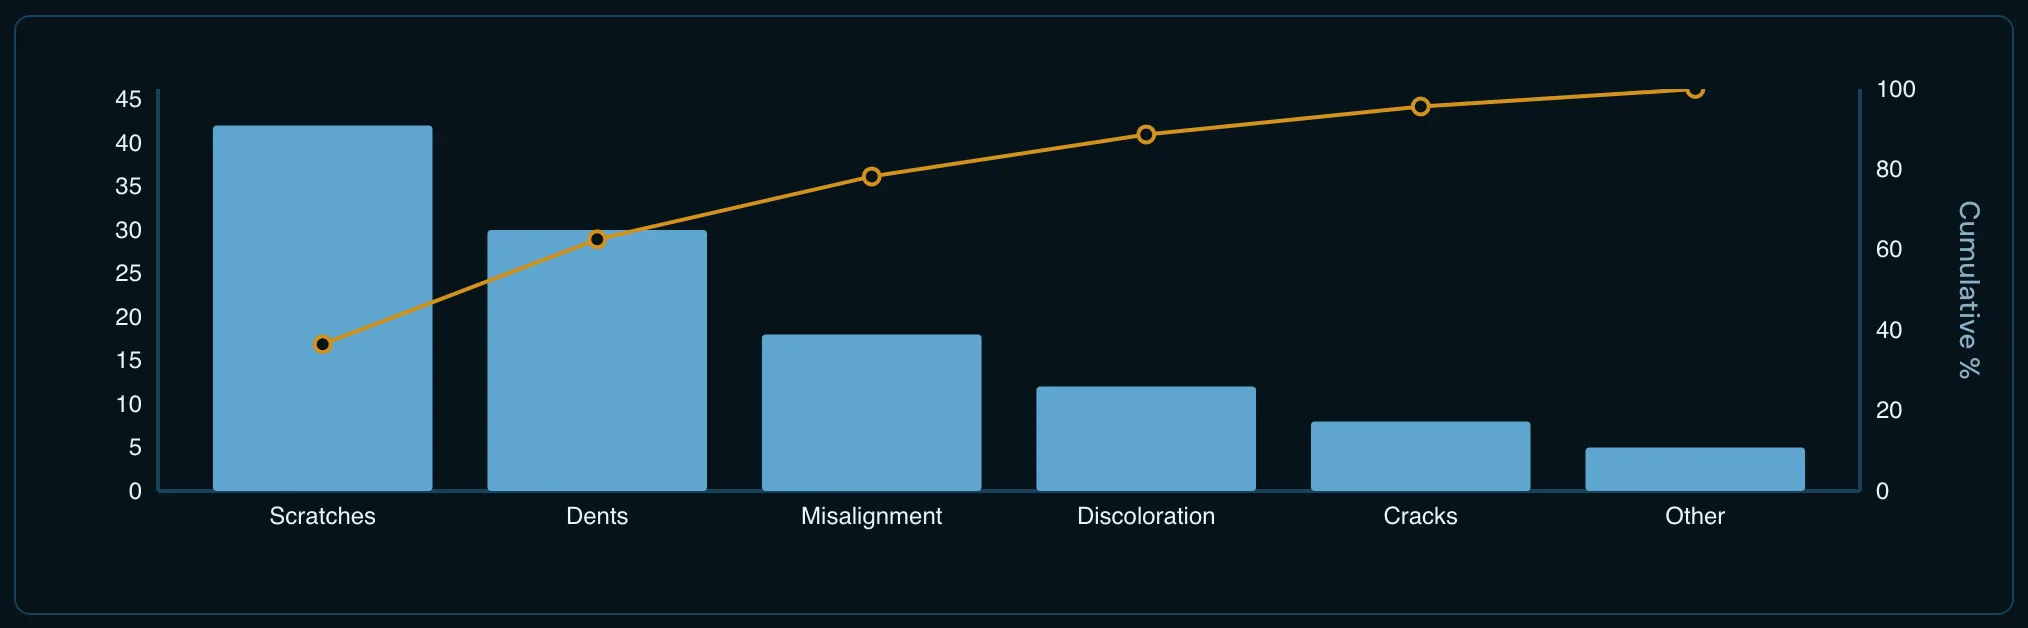 ParetoRanked bars with a cumulative line, for the vital-few reading.
 PieParts of a whole as angular segments, with donut and semi-circle variants.
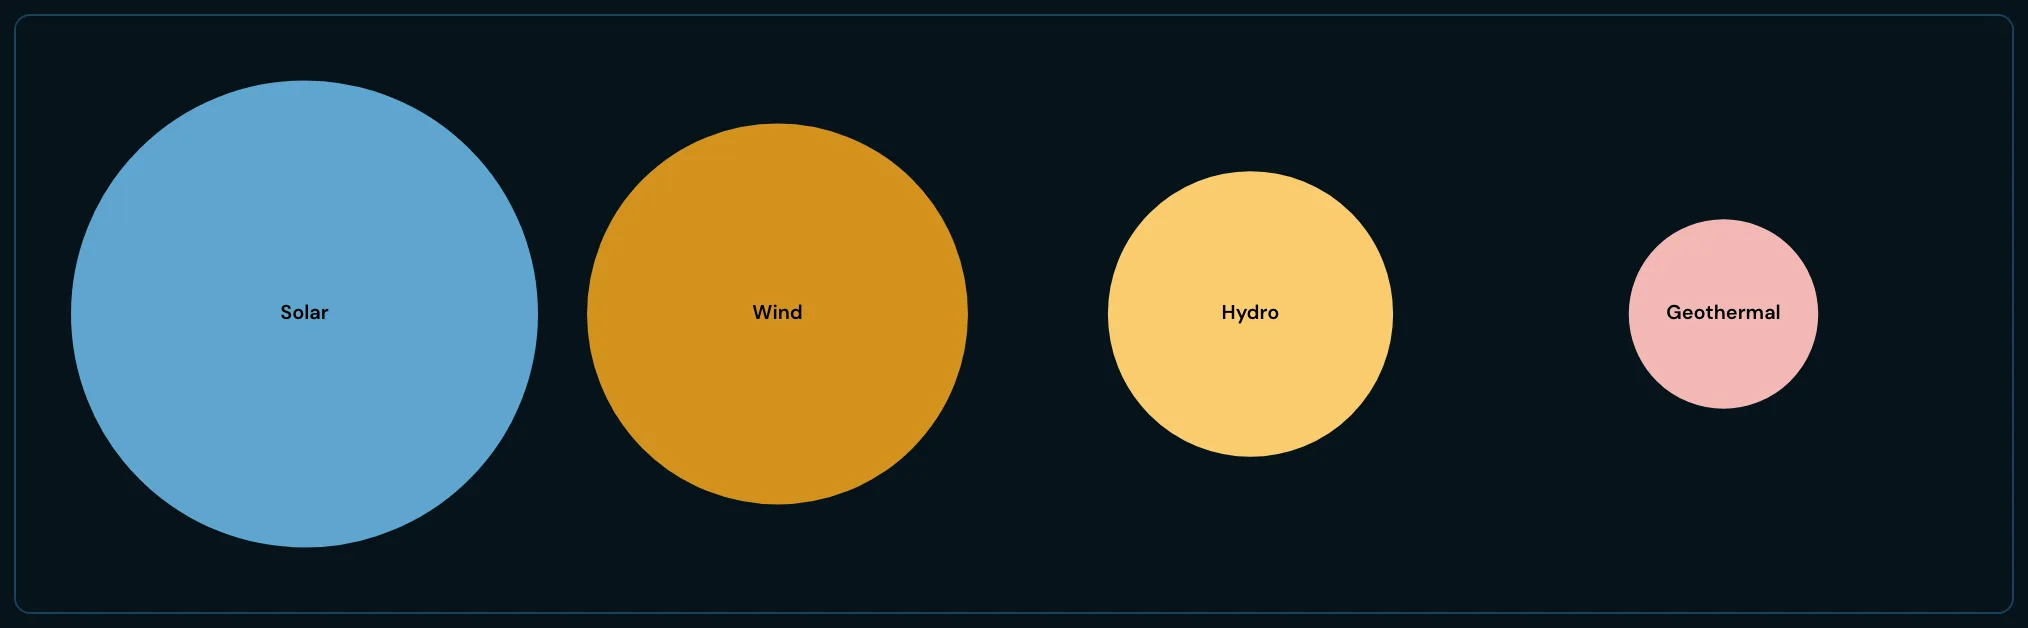 Proportional areaMagnitude as area — circles, squares, waffle grids and packed layouts, nested or in a row.
 RadarSeveral measures per series on radial axes from a shared center.
 Radial barBars wrapped onto concentric arcs, for compact categorical comparison.
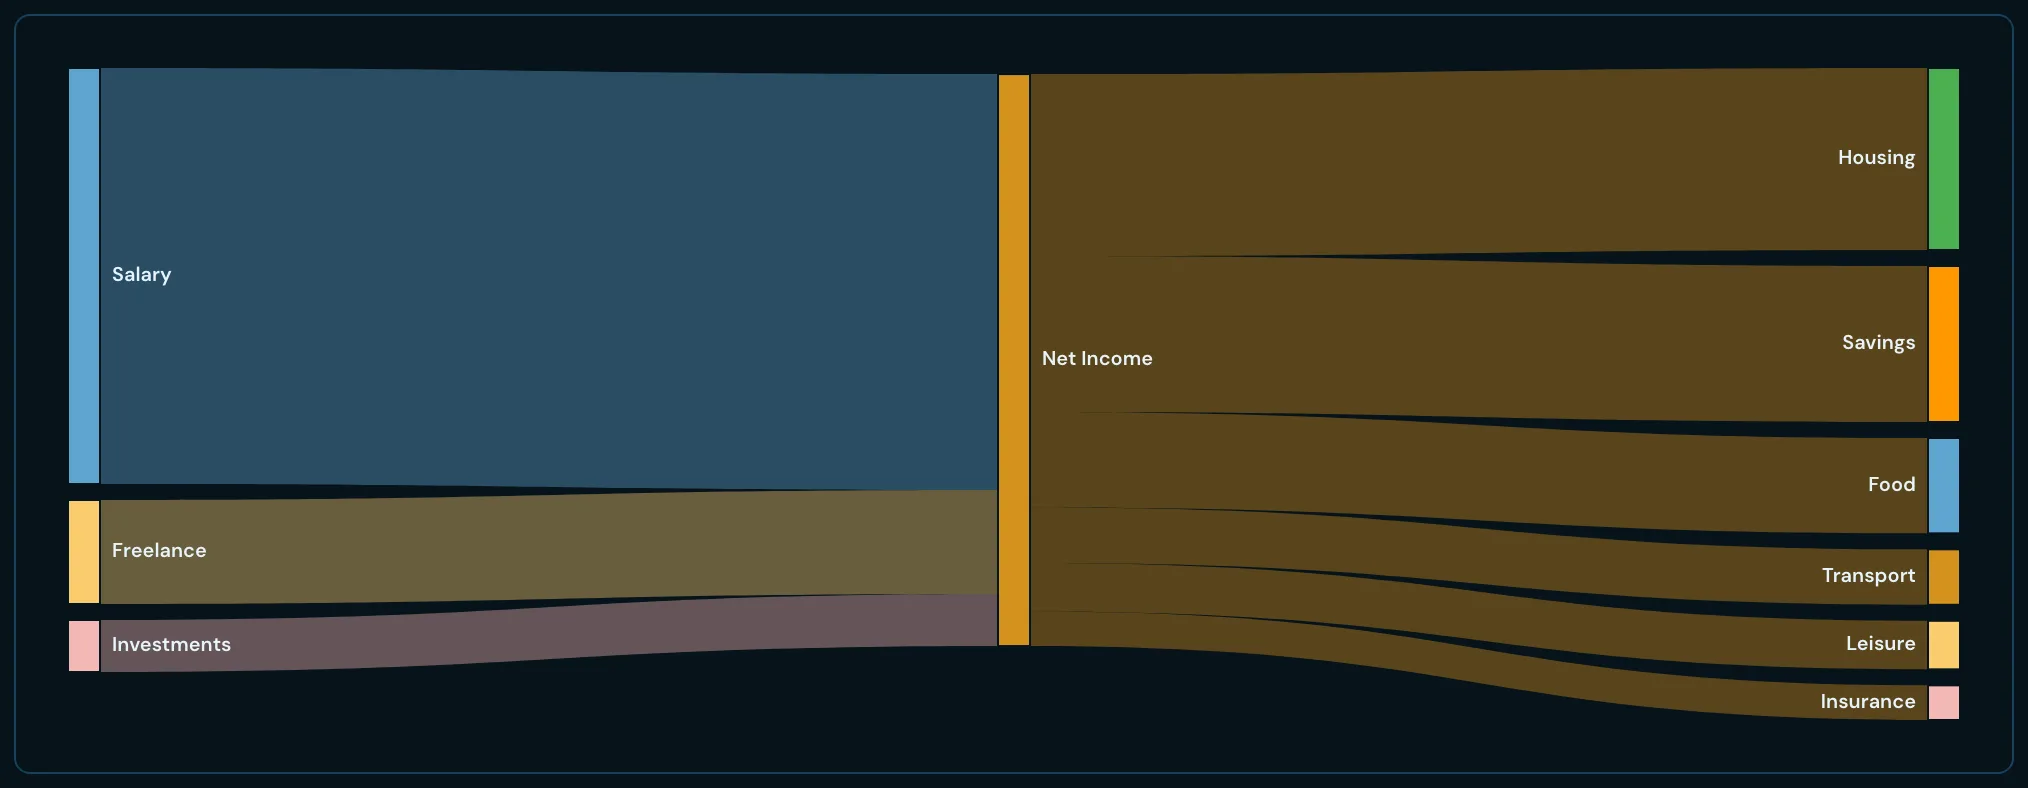 SankeyWeighted flow between stages, with link width carrying volume.
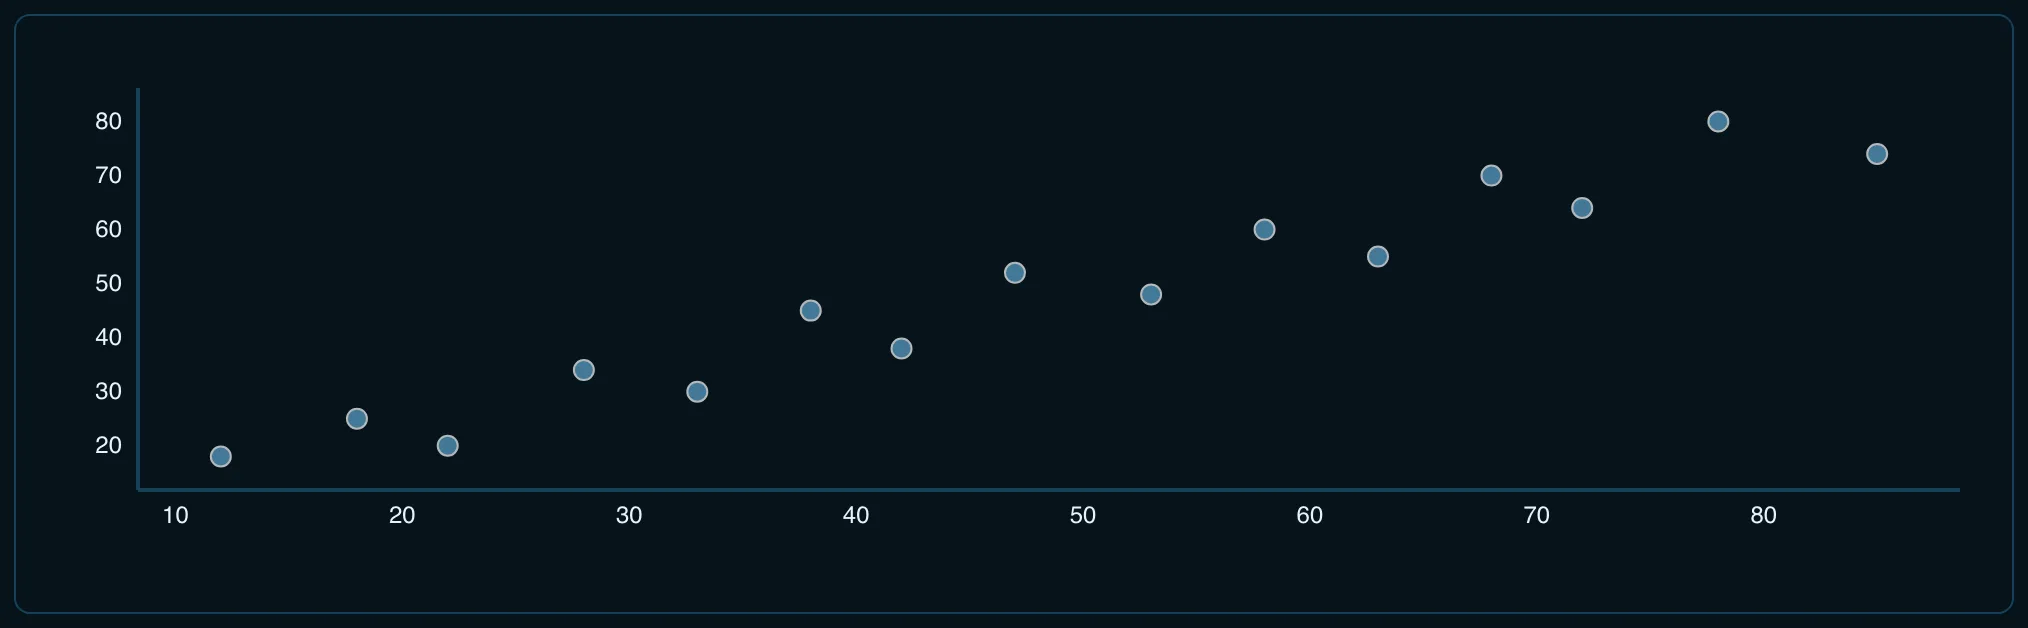 ScatterTwo continuous measures per point, for correlation and density.
 SparklineA trend stripped of axes and labels, sized to sit inline in a table cell — as a line, columns, or win-loss marks.
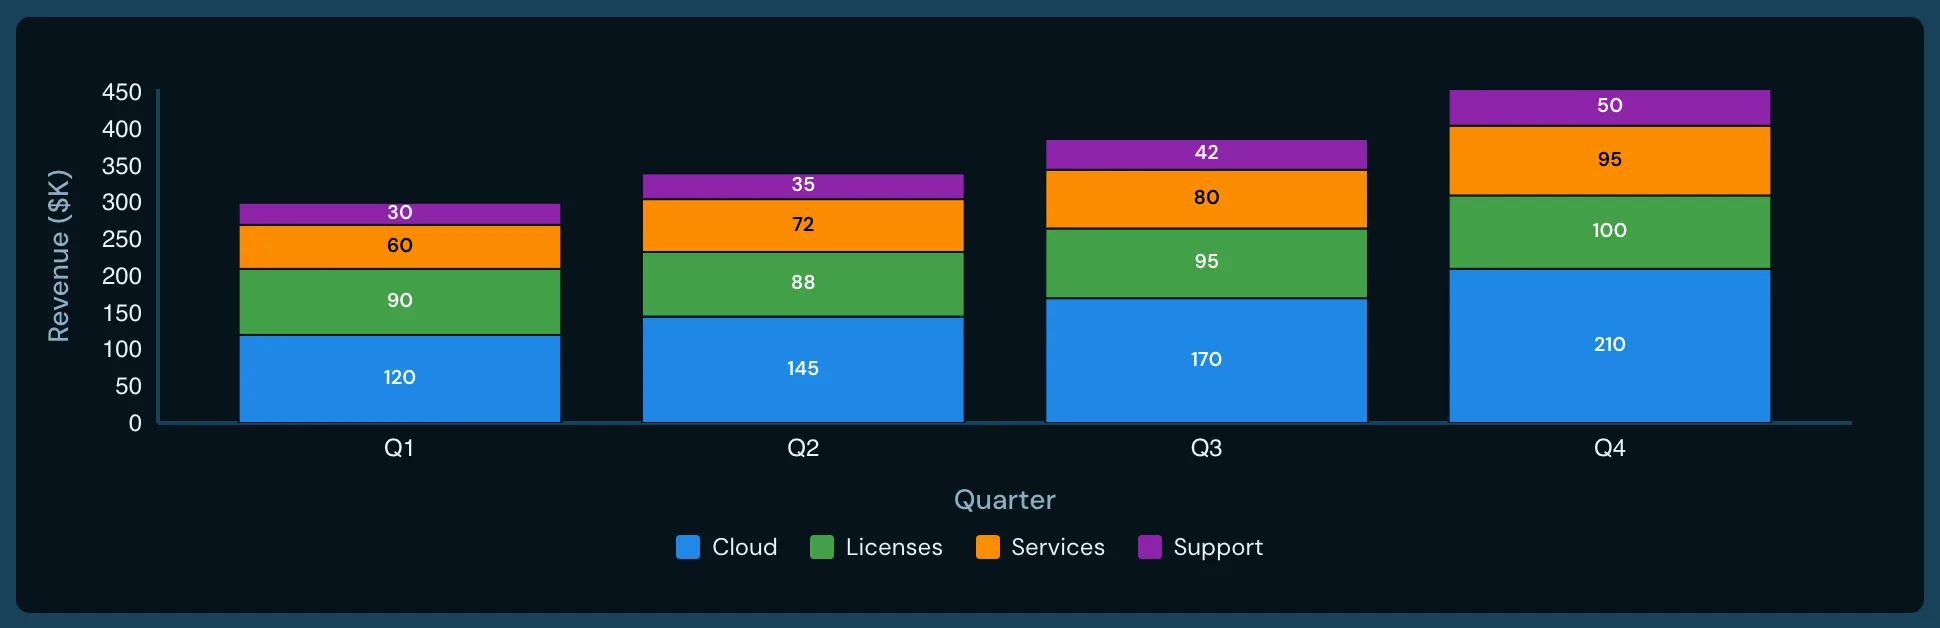 Stacked barCategory totals split into their contributing parts.
 SunburstHierarchy as concentric rings, each level subdividing the one inside it — or unrolled as an icicle.
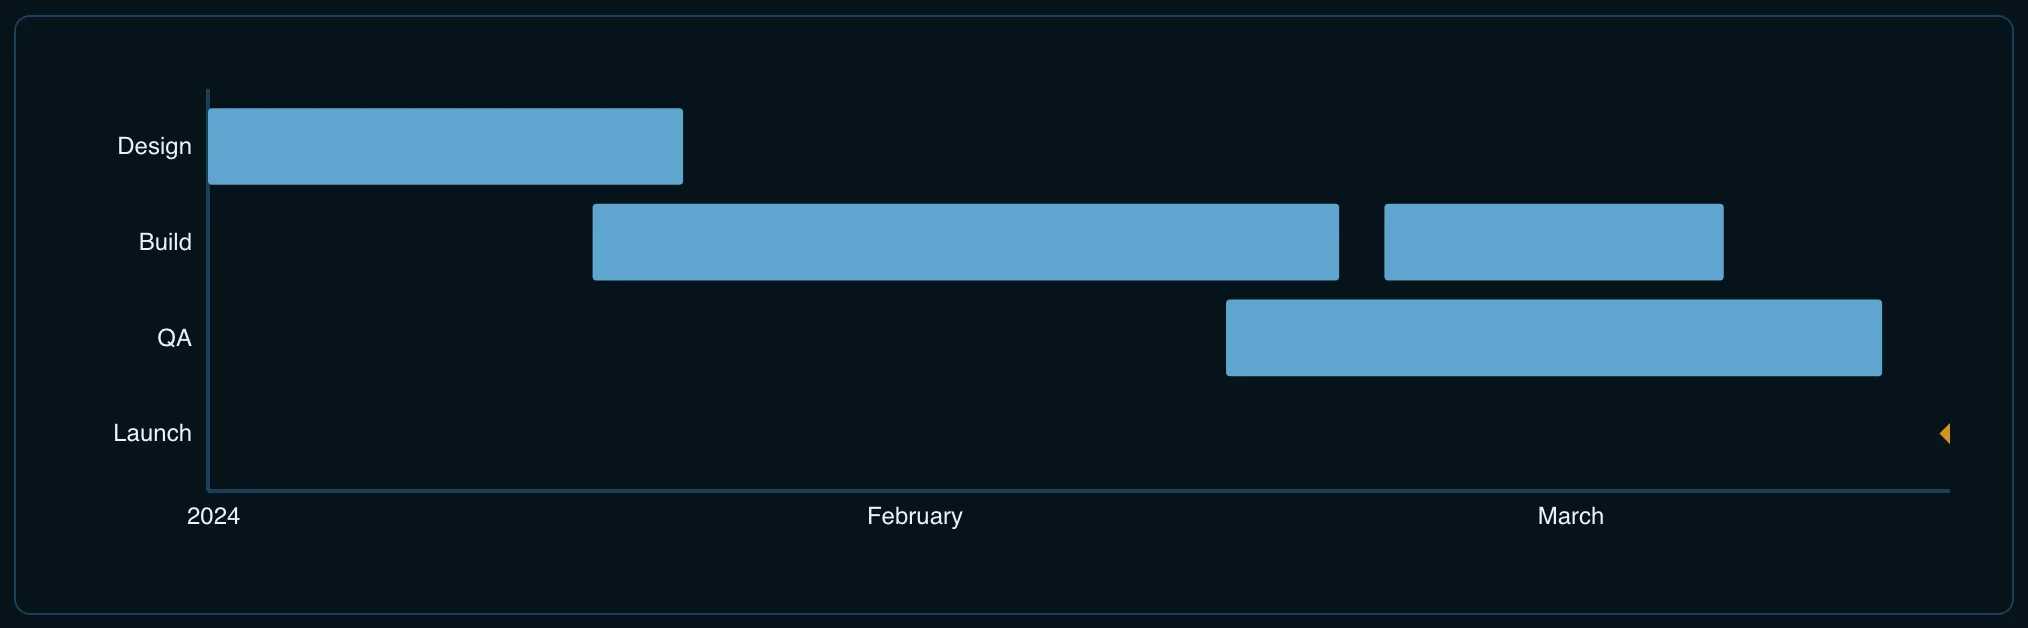 TimelineEvents and spans positioned along a time axis — the Gantt case included.
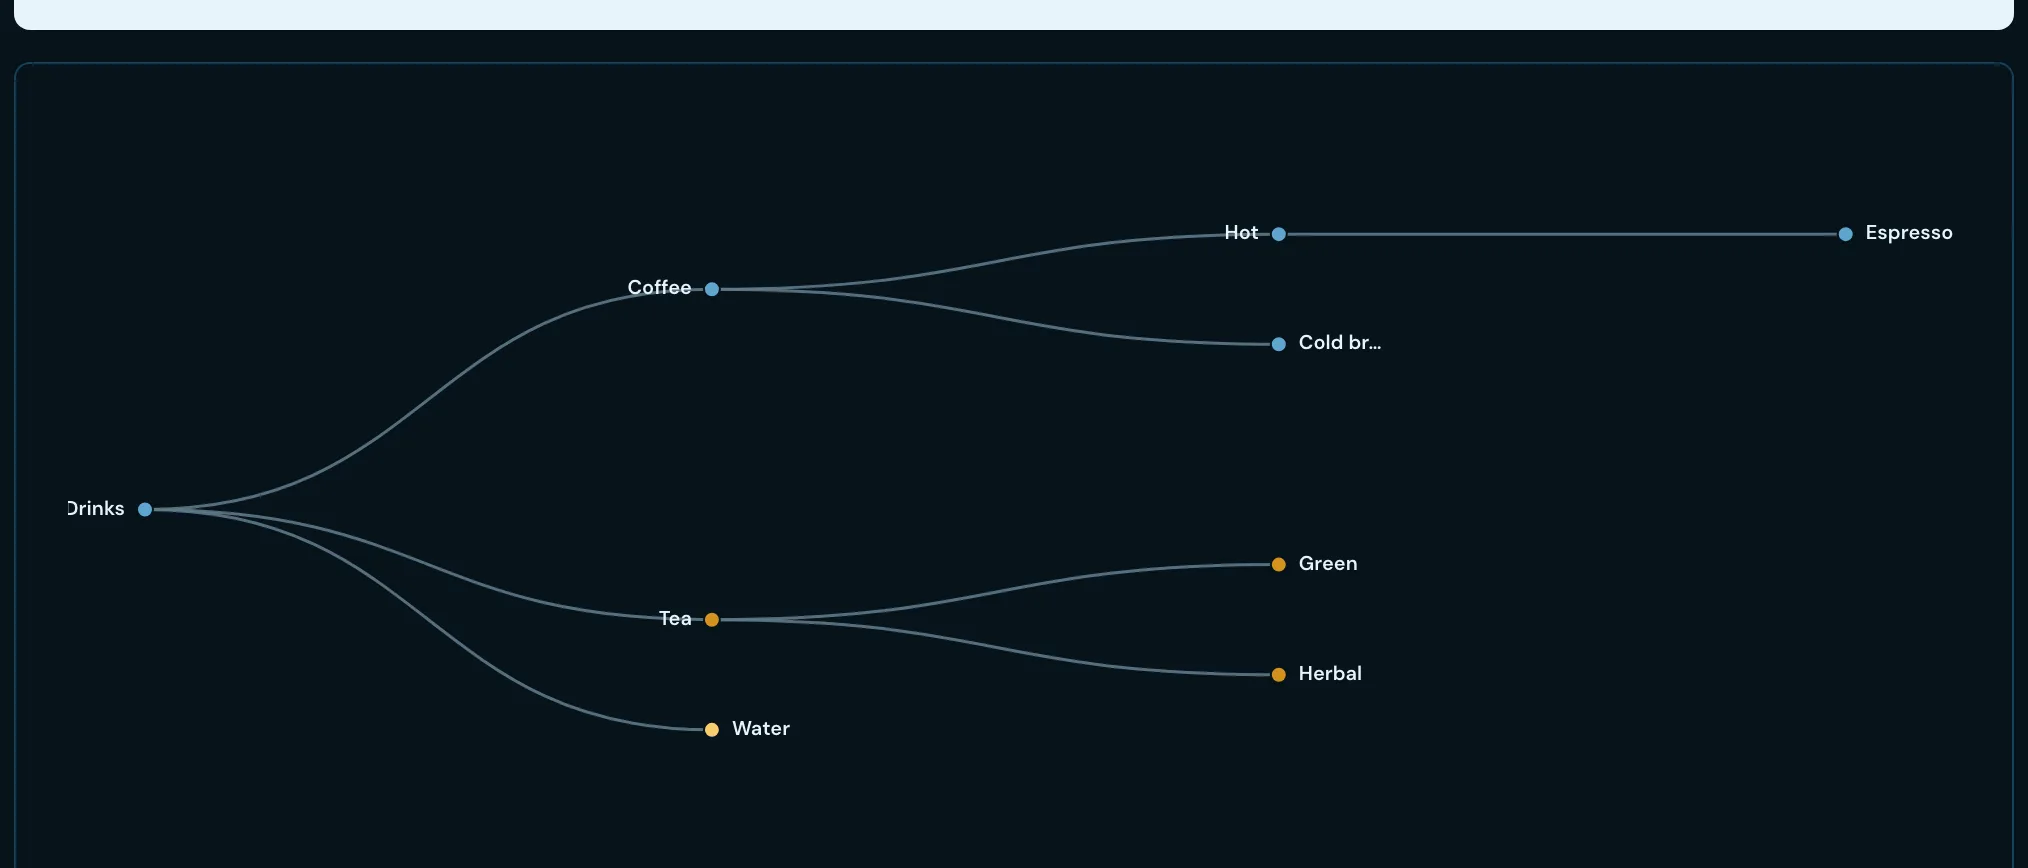 TreeParent-and-child hierarchy as a node-link diagram.
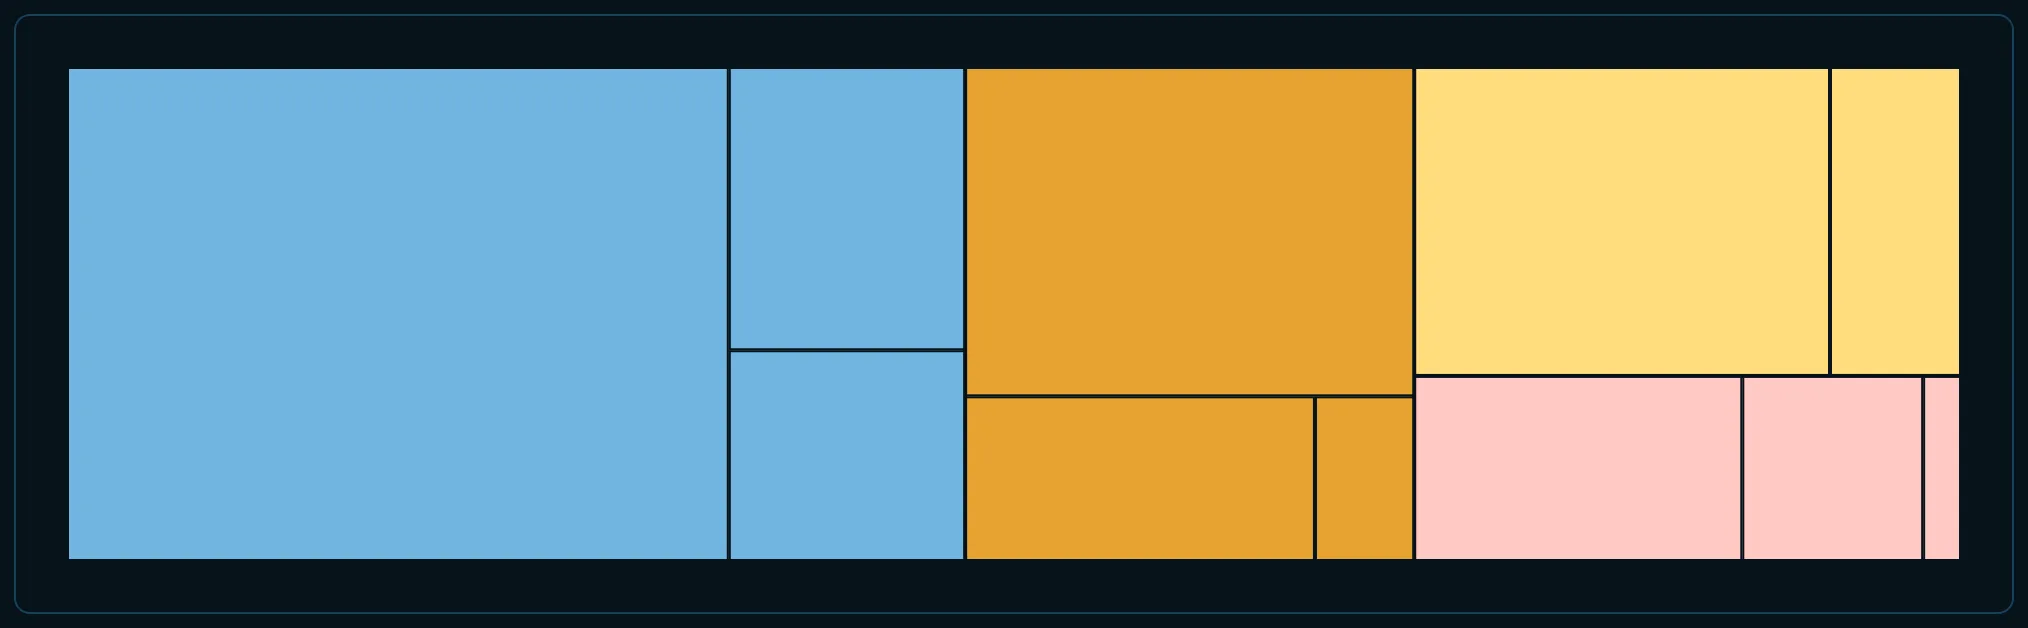 TreemapHierarchy as nested rectangles sized by value.
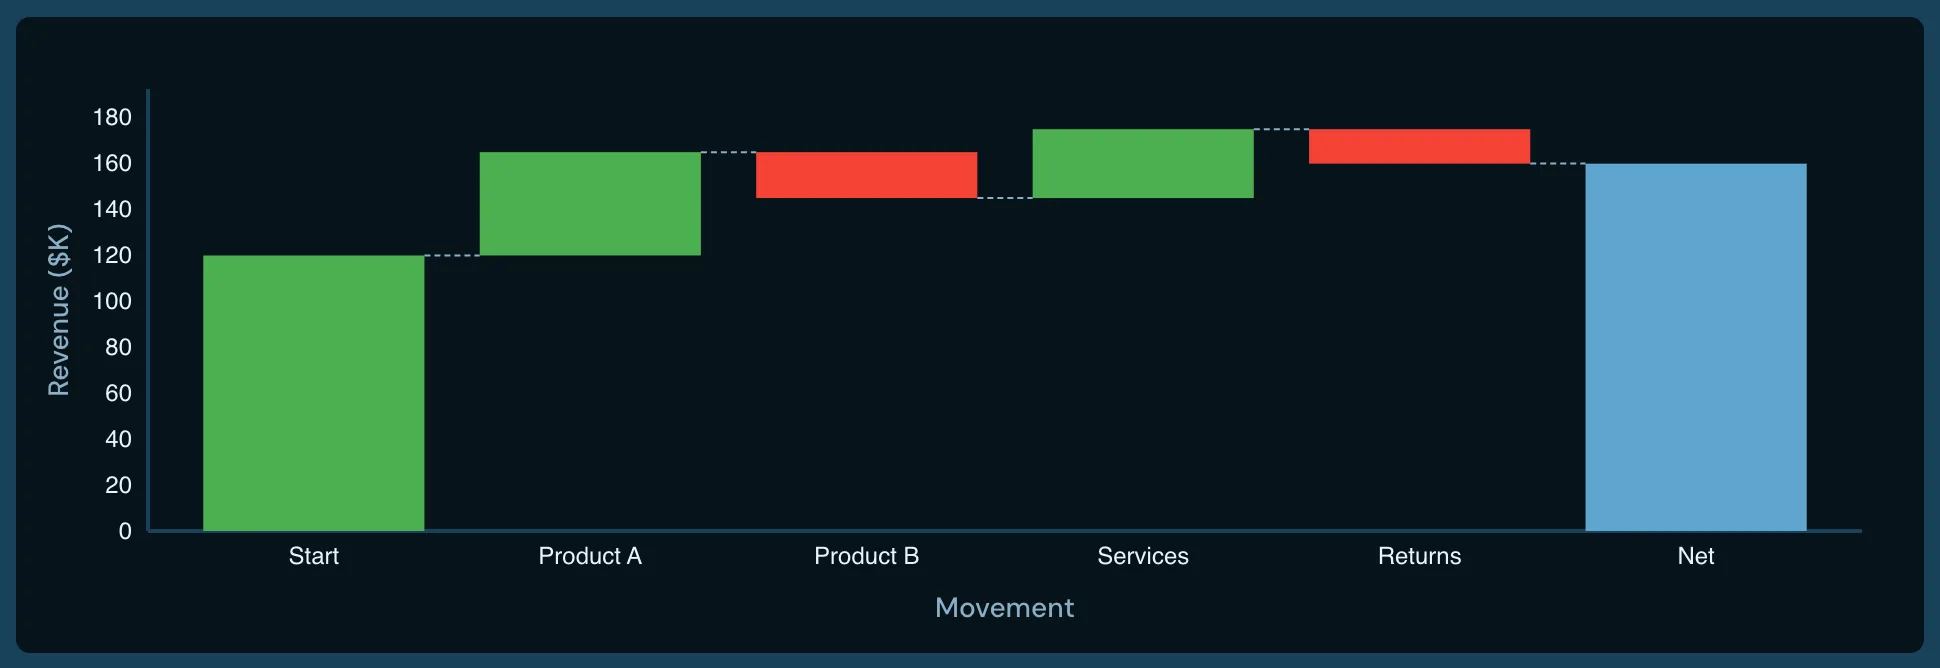 WaterfallSequential gains and losses bridging an opening total to a closing one.
 Word cloudTerm frequency as type size within a packed layout.
Cross-cutting
Capabilities that compose onto the types above rather than standing as charts of their own.
Composite chartsIndependent chart types layered on shared scales — bars behind trend lines, in one coordinate space. 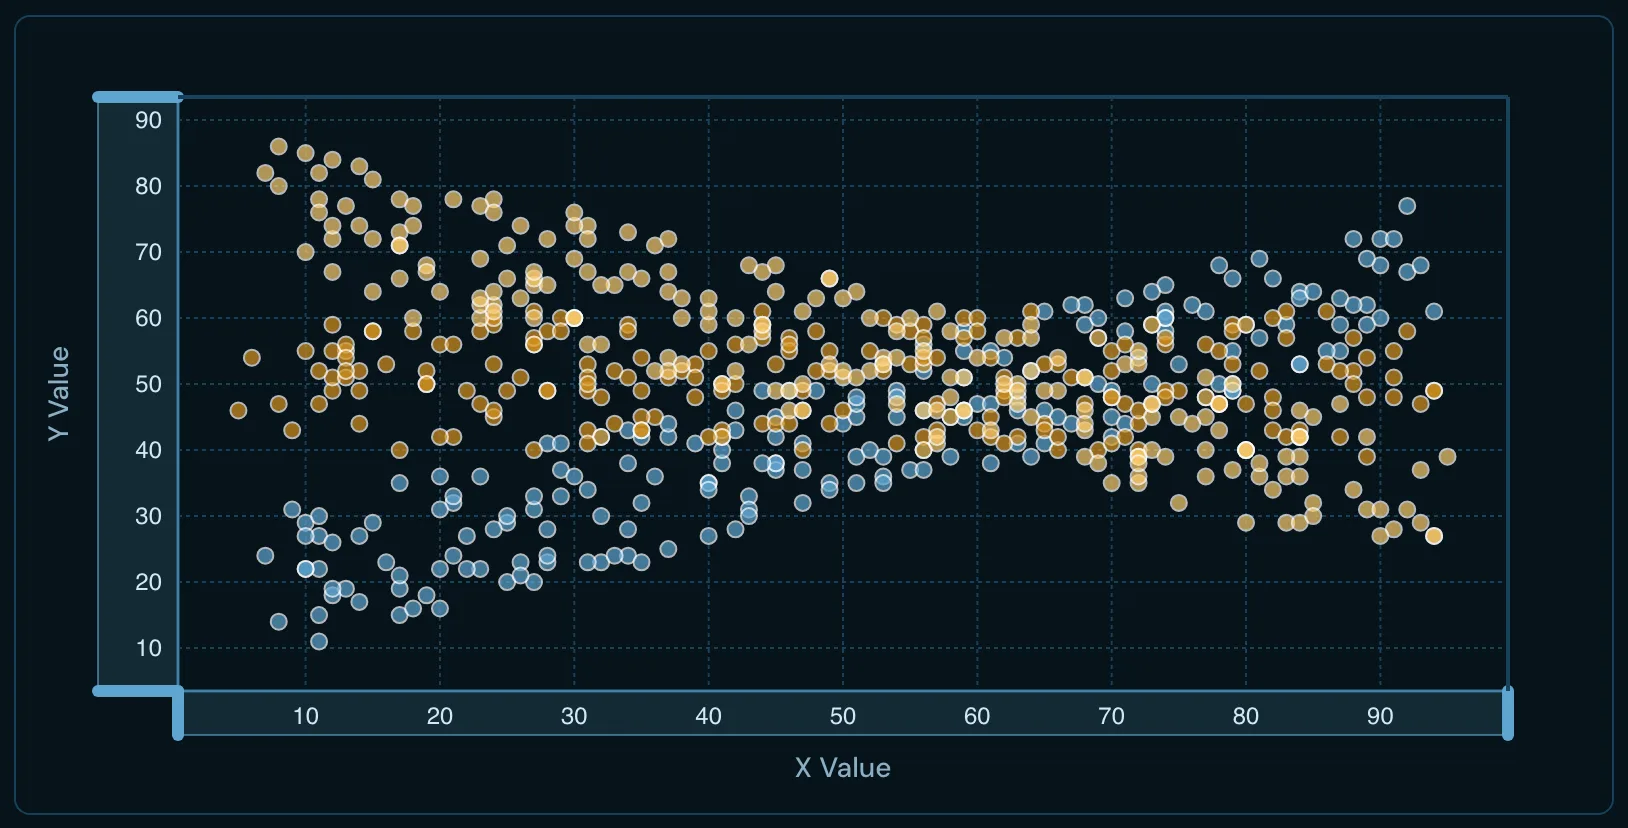 Range axesBrushable range handles on both axes — drag either scale to narrow the plot, and the points re-fit live.
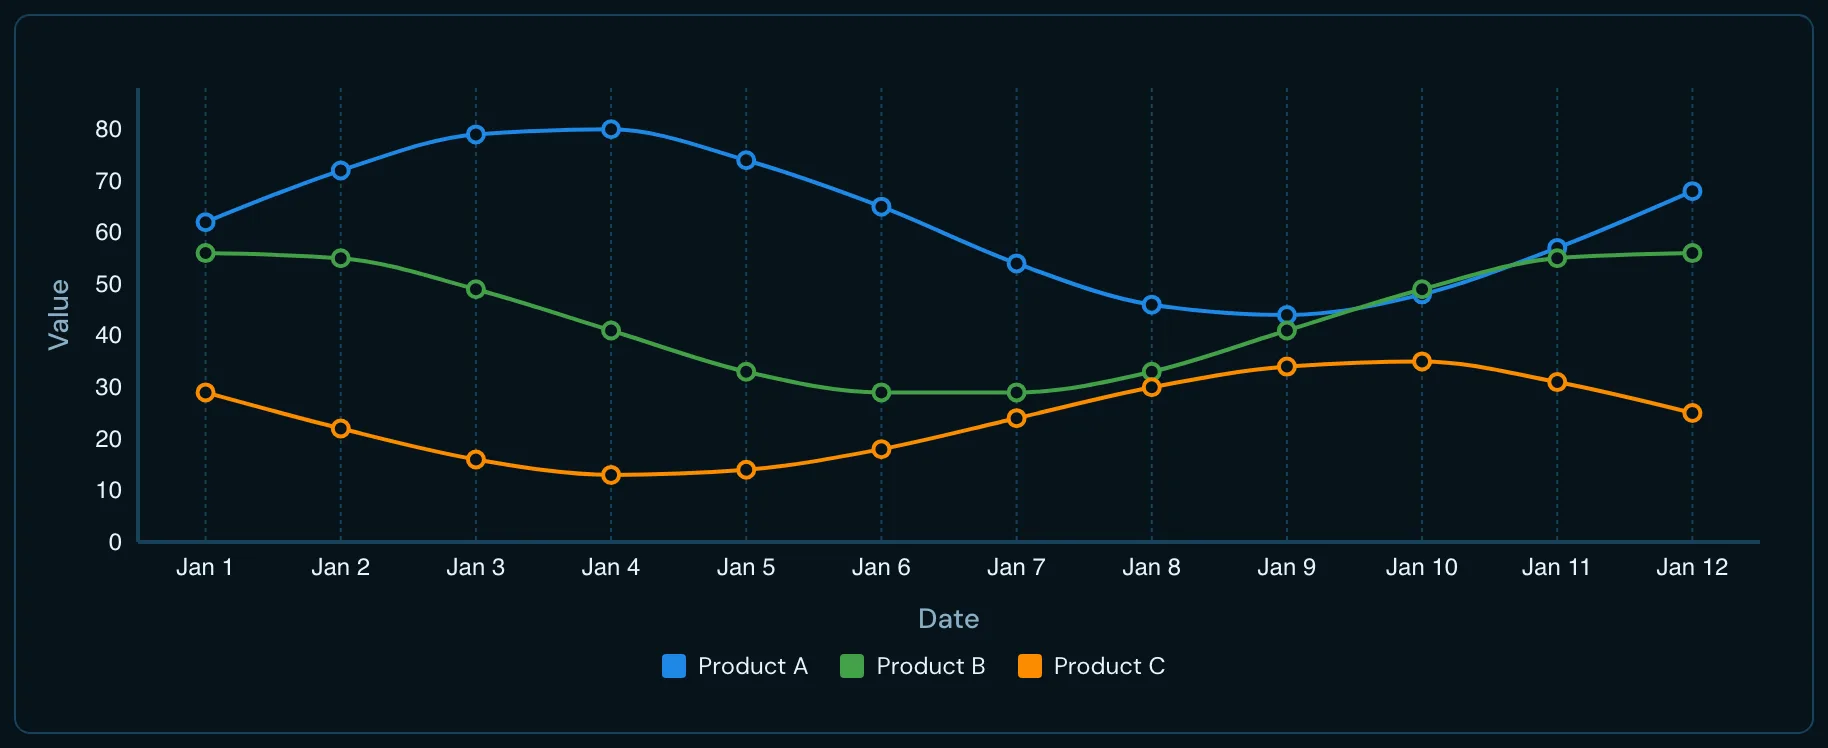 CrosshairA tracking rule pair that reads exact values off any cartesian chart.
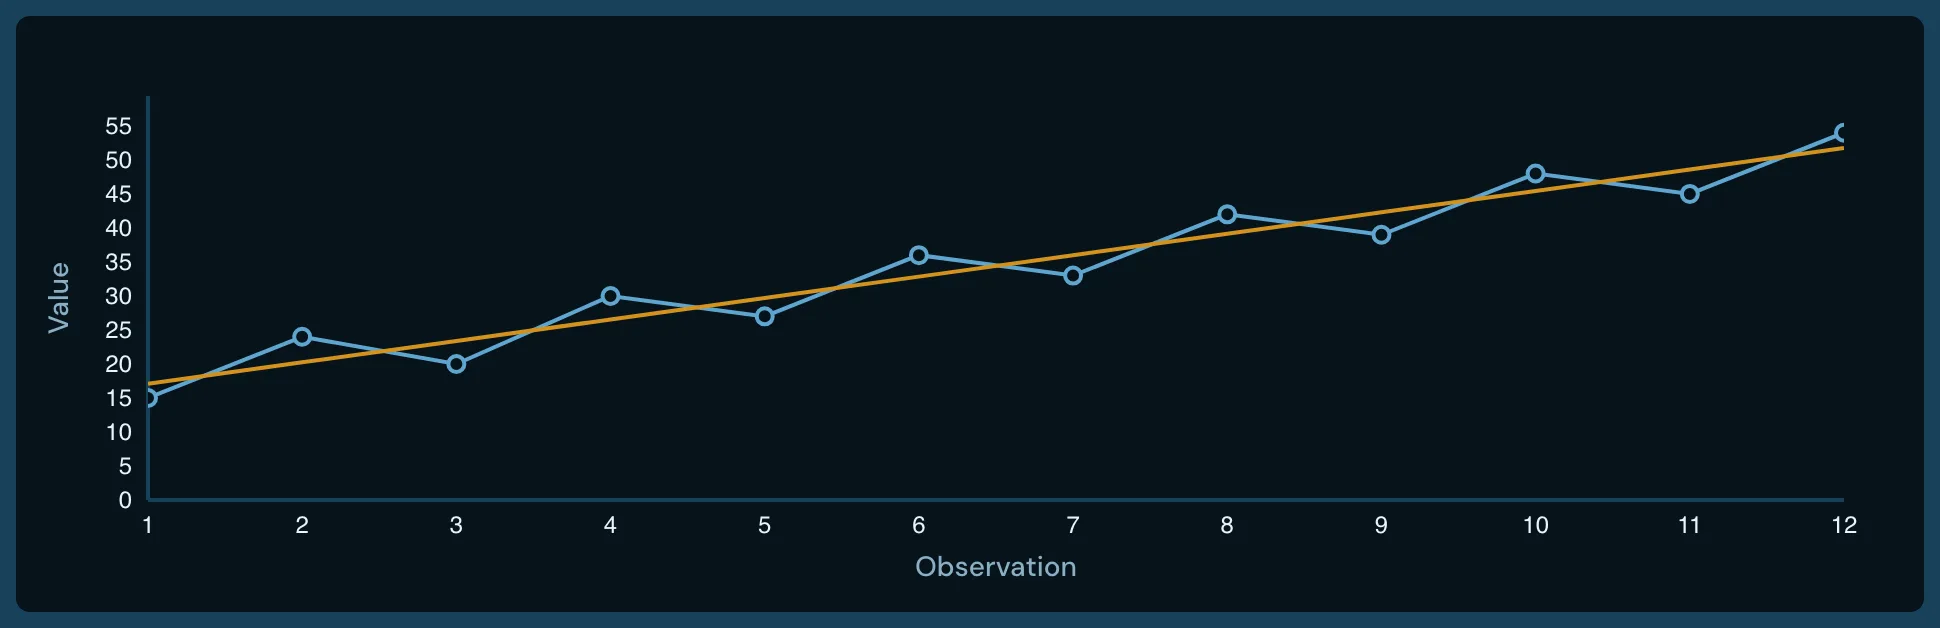 OverlayAnnotation layers — bands, thresholds and reference lines — over an existing plot.
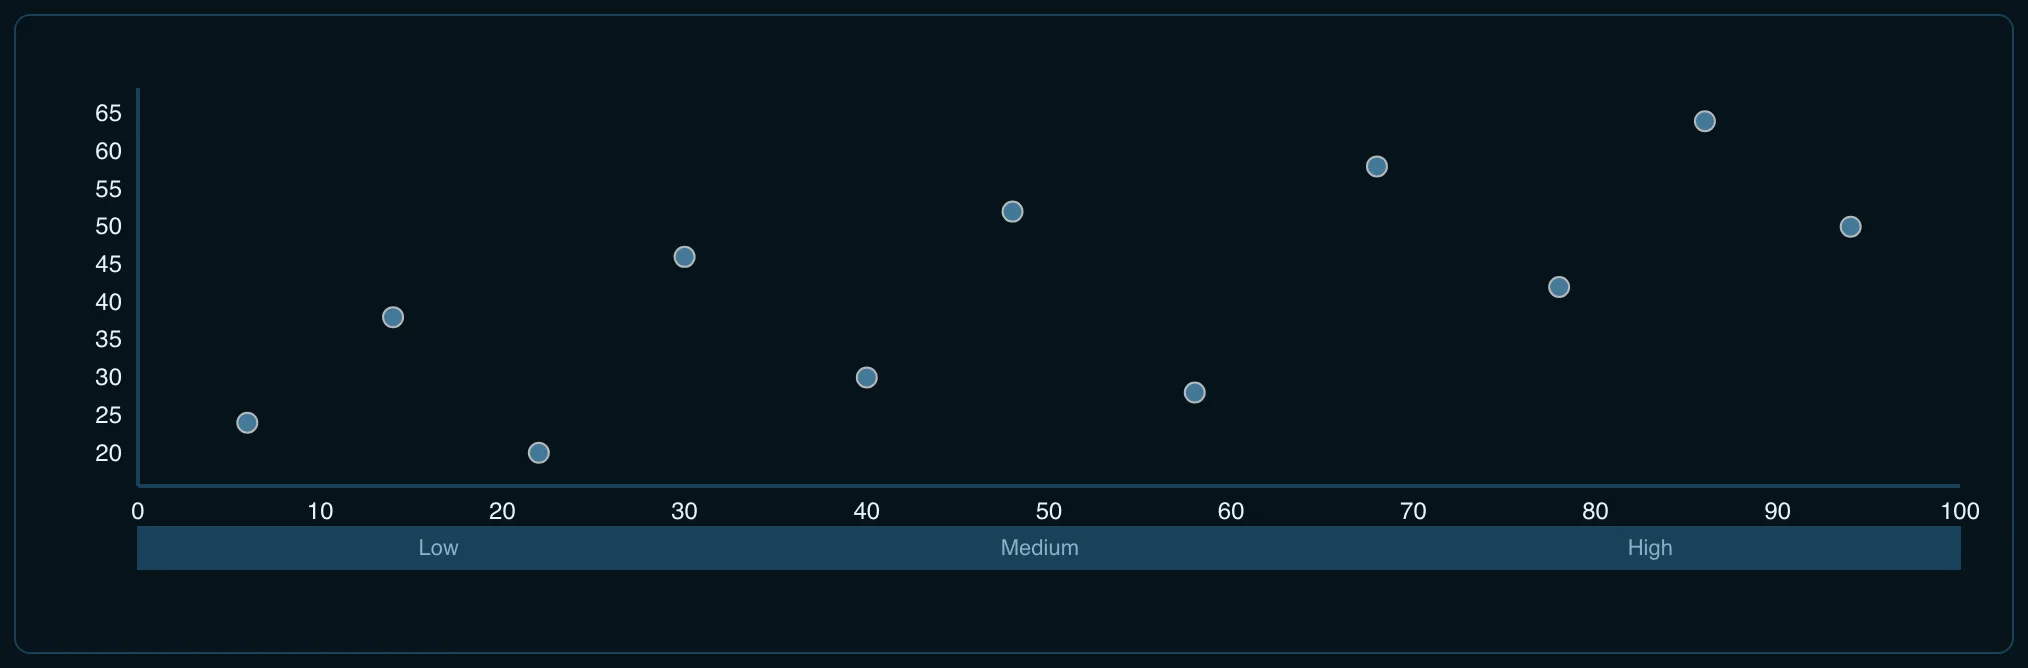 Axis grouping tiersStacked axis bands that label a second and third level of grouping beneath the ticks.
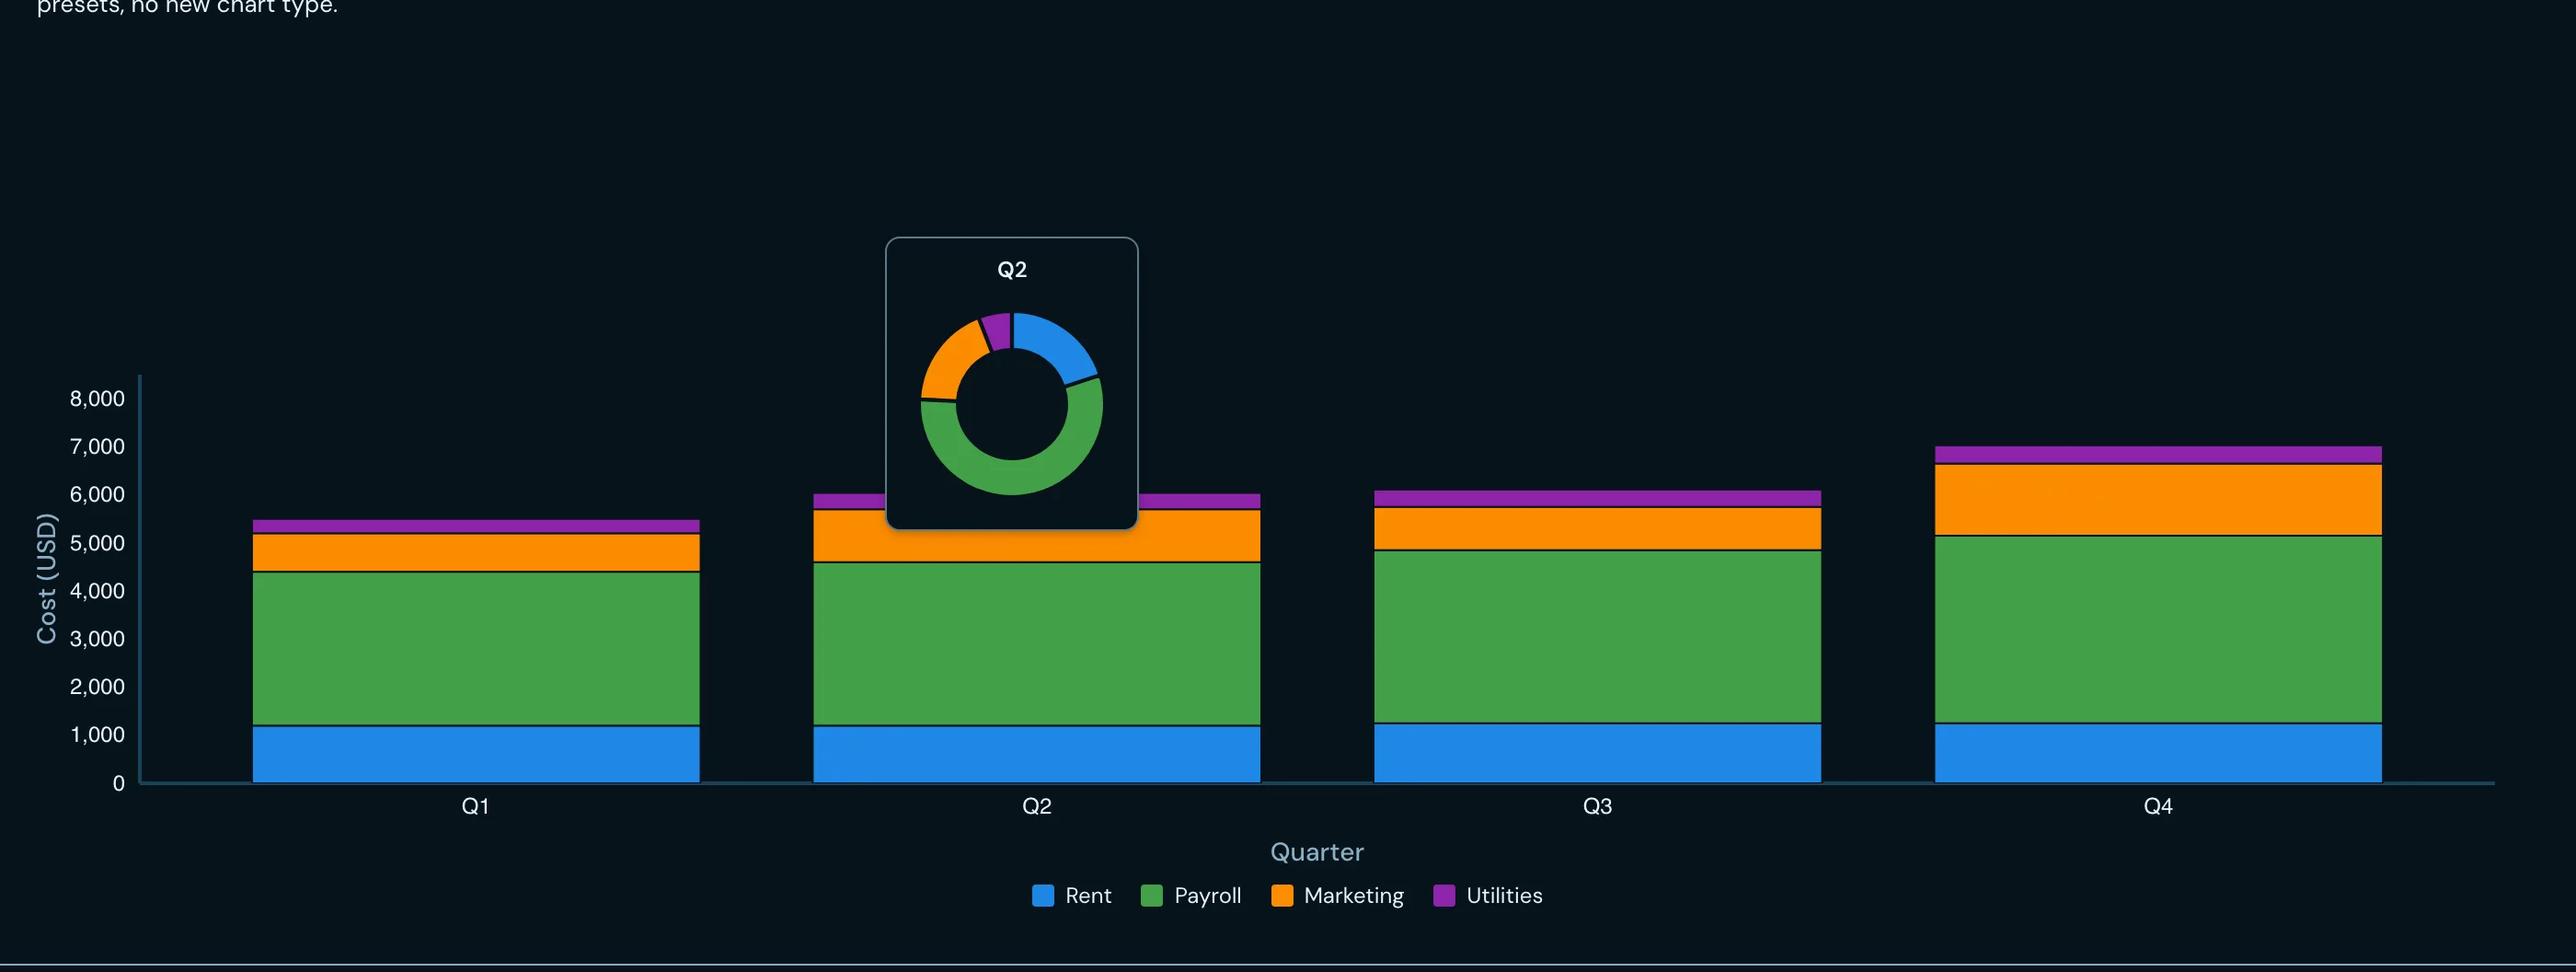 Chart in a tooltipA complete chart rendered inside another chart’s tooltip, drilling a stacked bar into a donut.
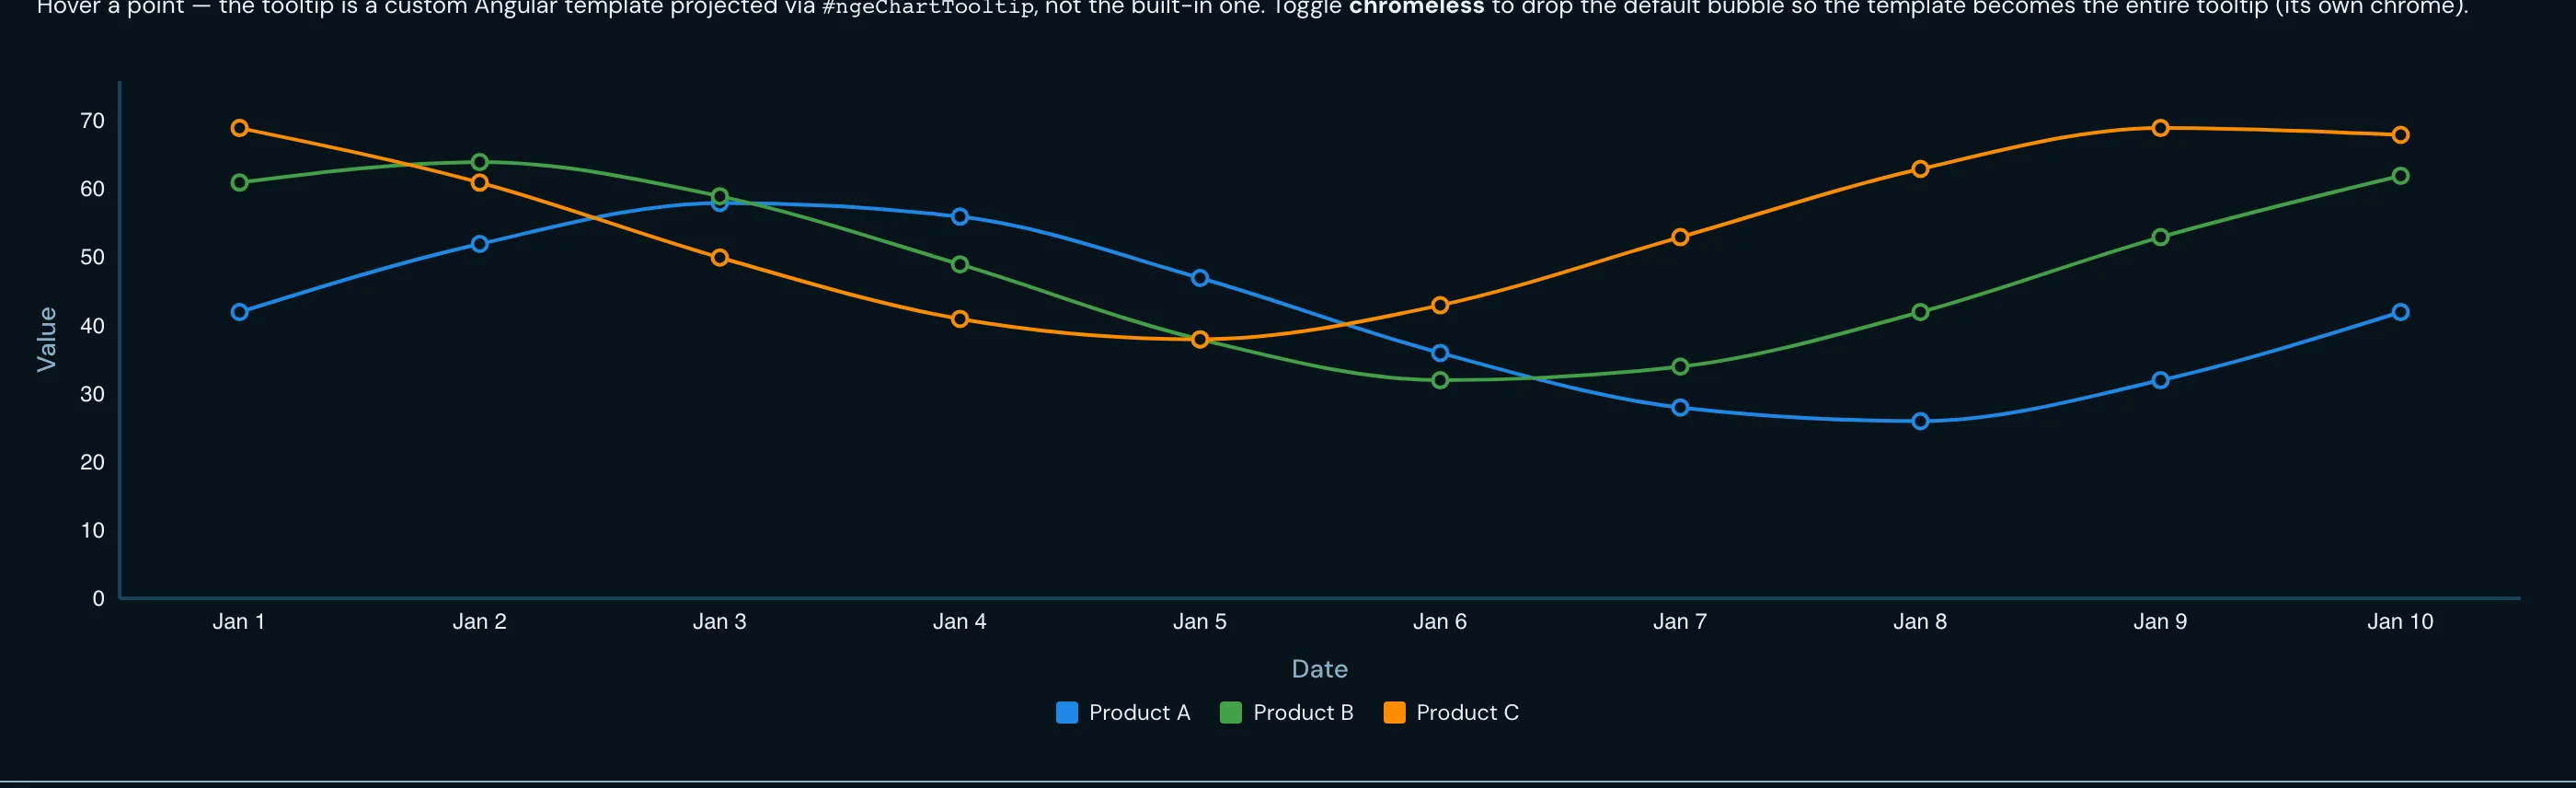 Custom tooltipArbitrary projected content in the tooltip surface, in place of the default readout.