Table
Spreadsheet-grade editing on a virtualized grid
An Angular table built for the cases a data grid usually hands back to the application: rectangular cell ranges, a fill handle, editors resolved per column, and charts rendered inside cells — all of it virtualized, and all of it measured at ten thousand rows. Styling is entirely CSS custom properties, so a consumer themes the grid without reaching into its markup.
52 published stories in Storybook
Showcase
Ten thousand rows, virtualized. Sort a column, resize a header, select rows — nothing is rendered off screen.
Spreadsheet-grade editing
The features that separate this from a read-only data grid.
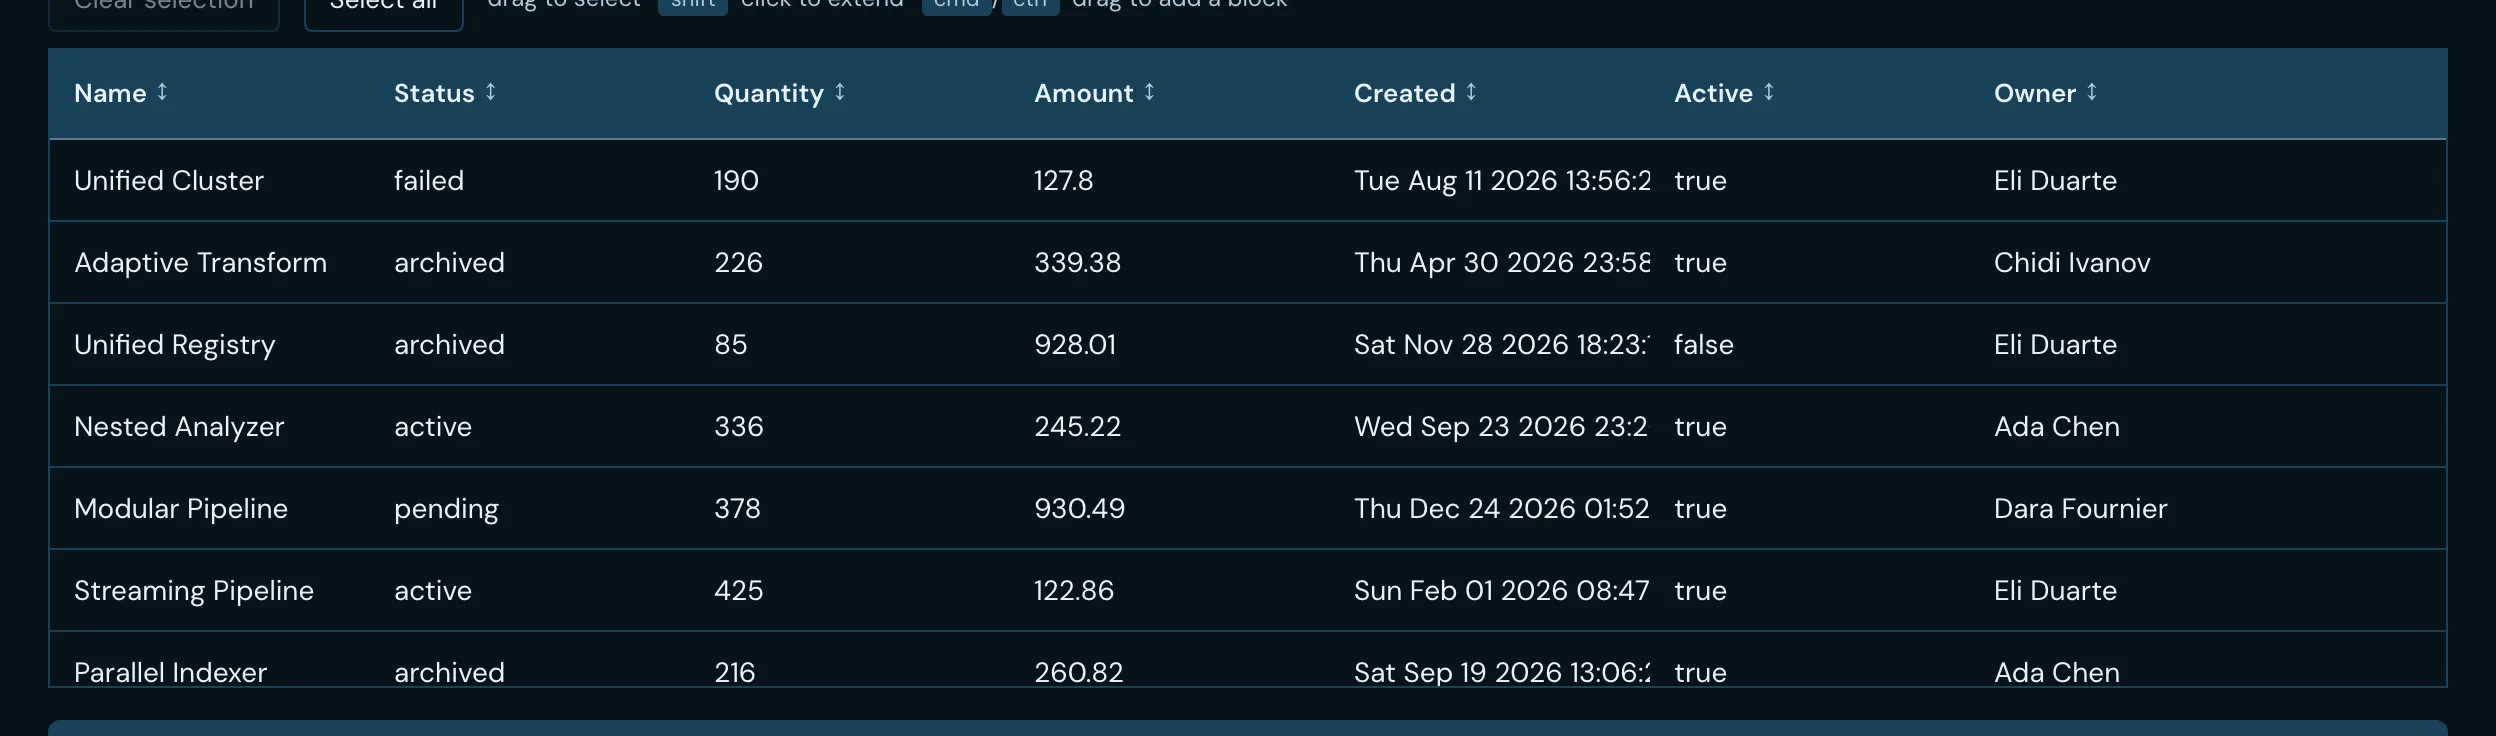 Cell rangeRectangular selection with keyboard extension, tracking an anchor and focus the way a spreadsheet does.
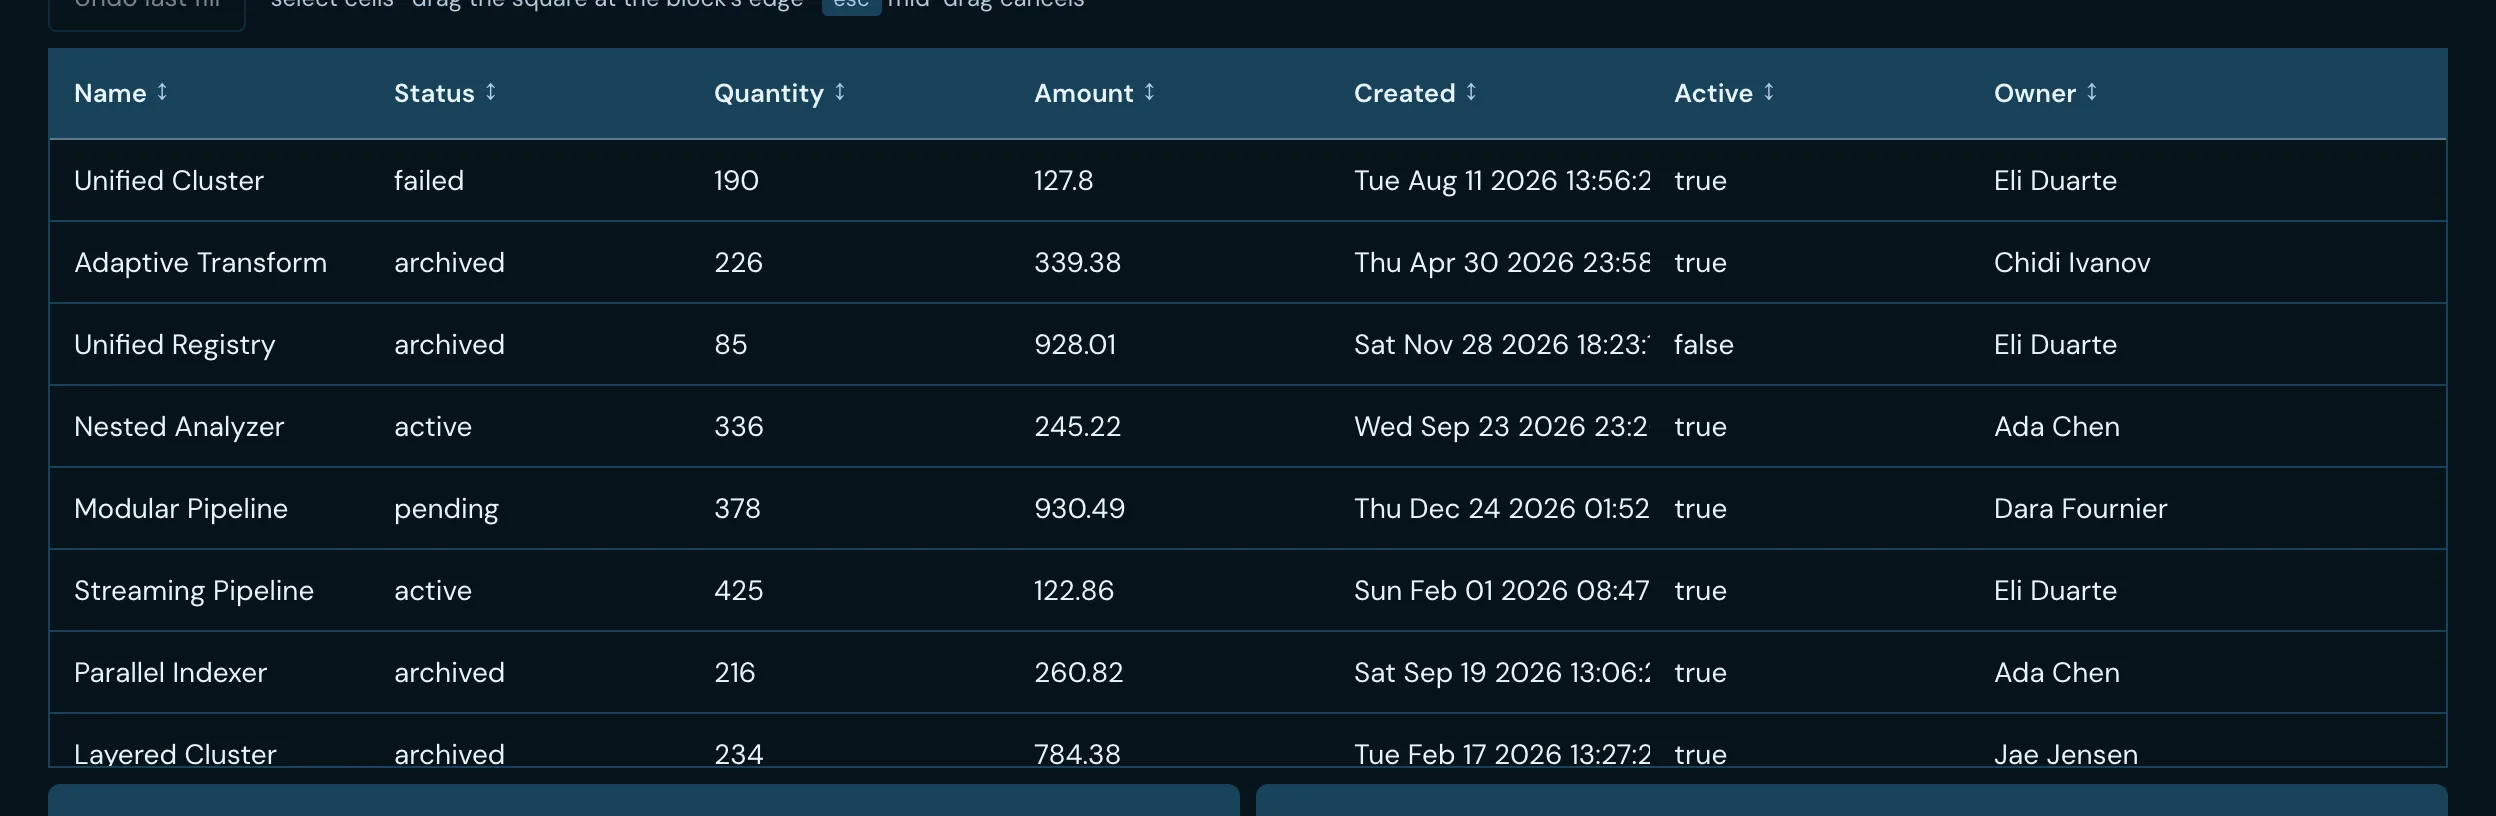 Fill handleDrag the corner of a selection to propagate its values across rows or columns.
Inline editingCommit a value in place, with dirty tracking and revert on escape. Cell editorsPer-column editor components resolved from the column definition rather than hard-coded. Cell selectA dropdown editor bound to the column’s own option set. Cell textareaMulti-line editing inside a cell, without disturbing row height until the value commits.
Rows, cells and structure
ShowcaseEvery feature enabled at once, over ten thousand rows. CoreThe base grid: columns, rows, headers and virtualization. 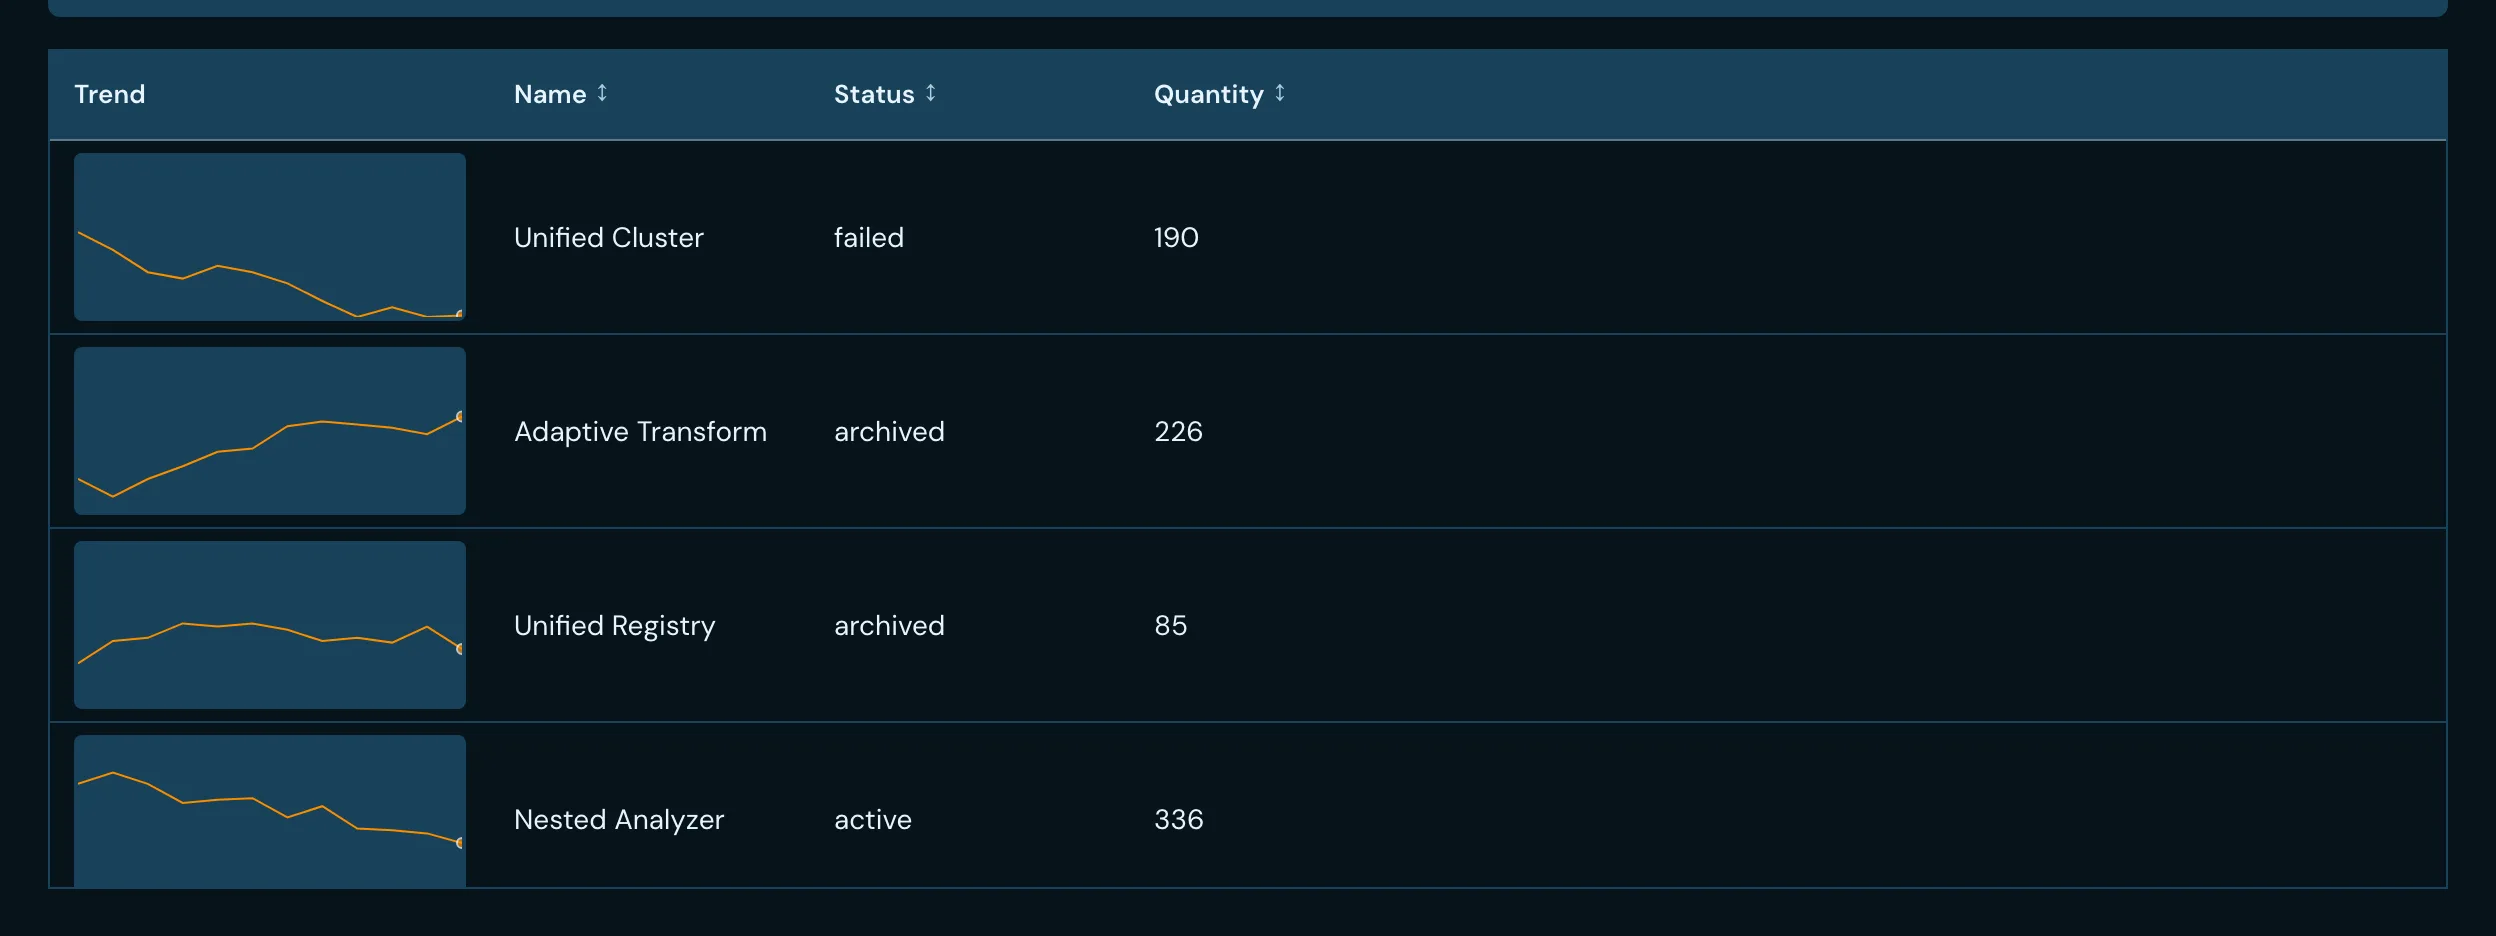 Chart cellsA chart rendered inside a cell, virtualized along with everything around it.
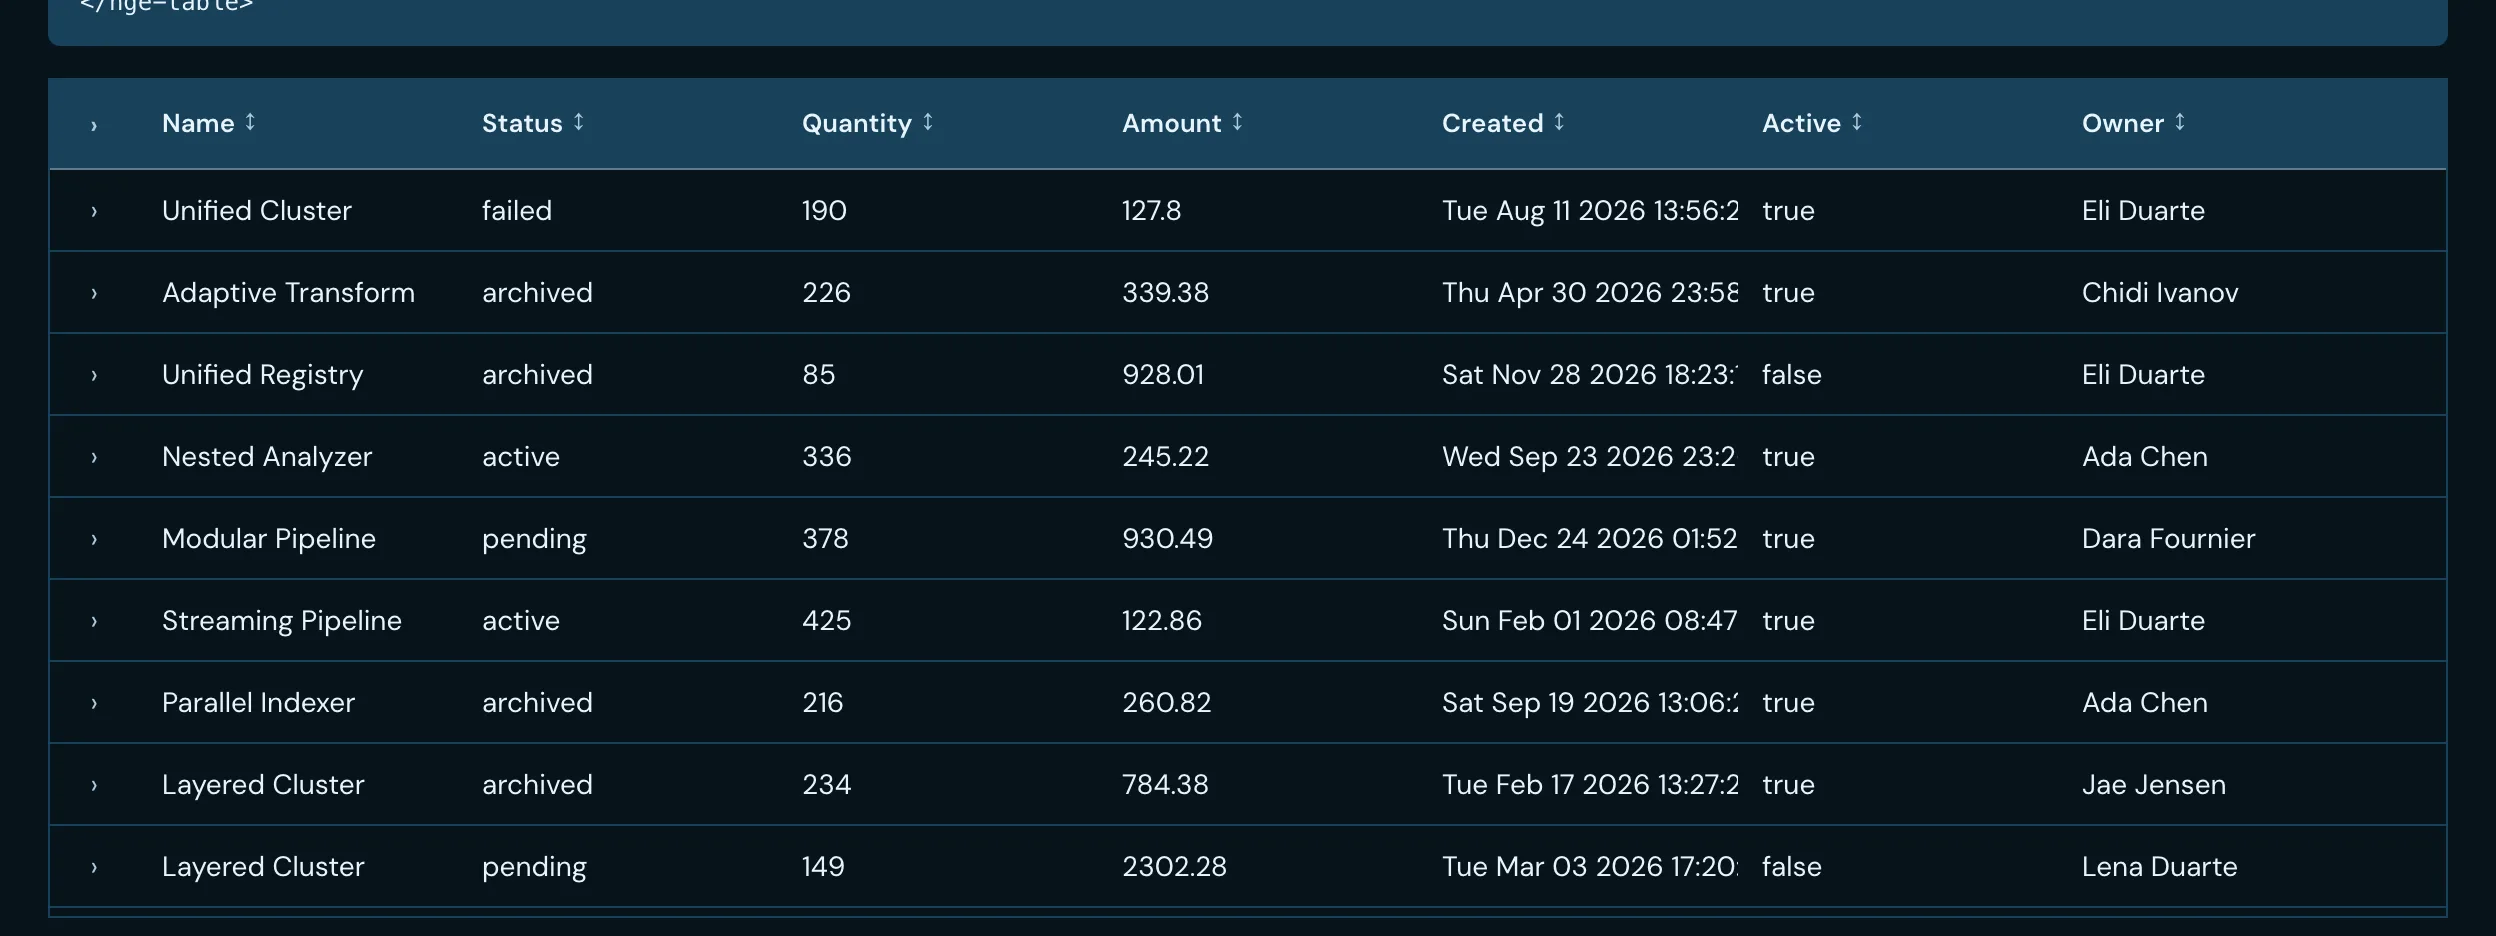 Row expansionRows that open to reveal a detail region beneath them.
Row detail contentProjected content inside the expanded region, typed to the row that opened it. HighlightMatch highlighting across cells, for search and filter results. StripingAlternating row treatment driven by theme tokens rather than by markup.
Selection and export
Performance
Instrumented stories, kept in the library so a regression shows up as a number rather than as a feeling.